


A Killer Microsite & Interactive Web Design Experience That Will Inspire You! Microsite and interactive data tool that is the future of data design If a good infographic tells a story, then

Telling Stories With Data: From Simplification to Persuasion and Reporting. The Most Common Questions From Our Data Visualization Workshops. We can run our Data Visualization Workshops anywhere in the world,

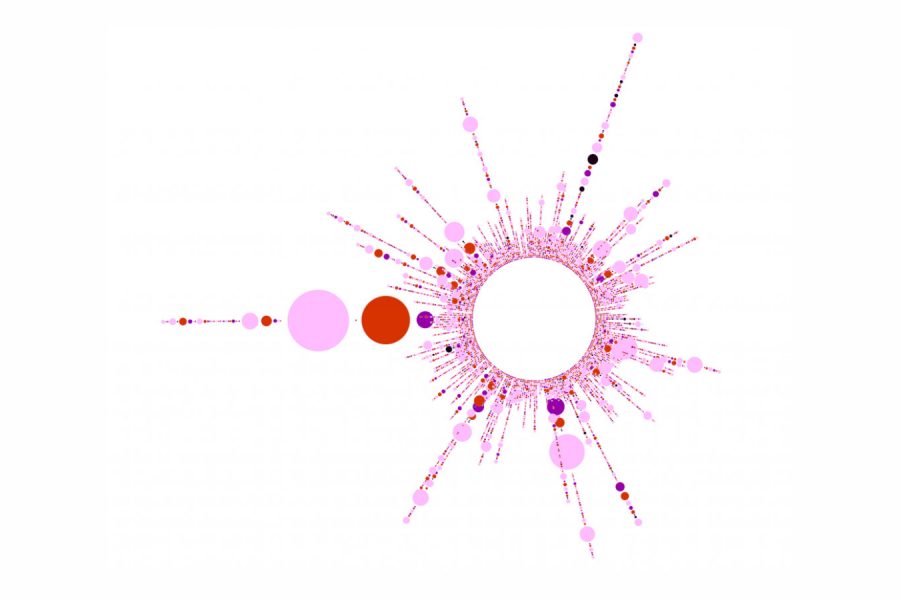
Excel Data Visualization Artwork Project. Creating beautiful, artistic work exclusively in Excel. We were tasked by a digital agency to create something different for their client, using only the Microsoft product

See Tableau dashboards examples in the wild. We've tracked down the best example of dashboard design done in Tableau. Get inspired.
4 Marketing Analytics Trends That Will Kill It In 2016 As digital marketing continues to evolve and marketers gear up for 2016, here are the 4 analytics trends that we
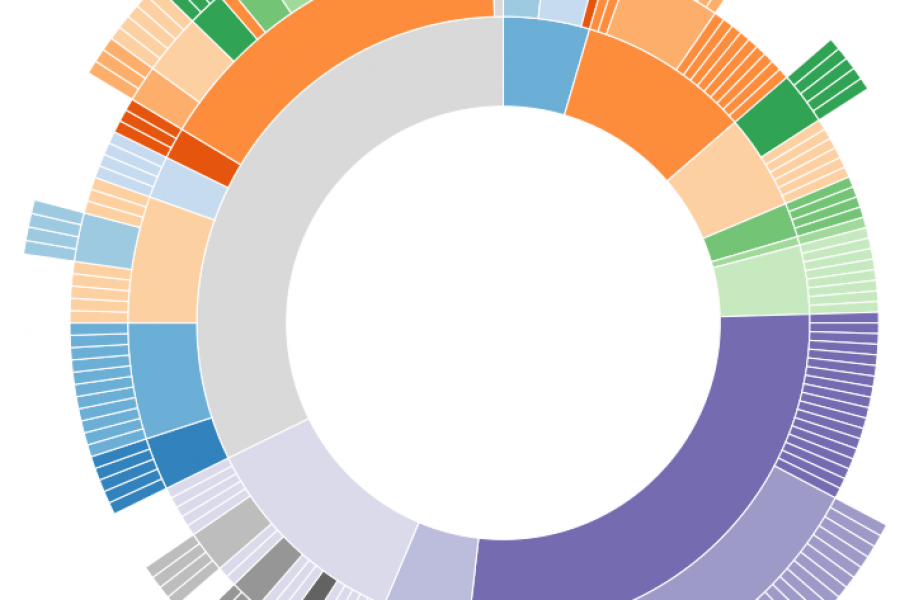
8 More Common Types of Data Visualization Following up on our previous list of 15 Types of Data Visualization, which you can find here, we’ve come up with 8 more
Our List of Data Visualisation Conferences for 2016 *Update November 2016* We’ve updated this list for 2017’s conferences. Click the link to see the best data visualisation conference for 2017.
What Makes for Great Data Visualization and Why? Data visualization can be a powerful way to communicate. When done right, it delivers information with both the weight of respected research,

What to Look for in a Data Visualisation Agency? Data visualization is a powerful way to communicate new and complex information. When done right, it can deliver your message with
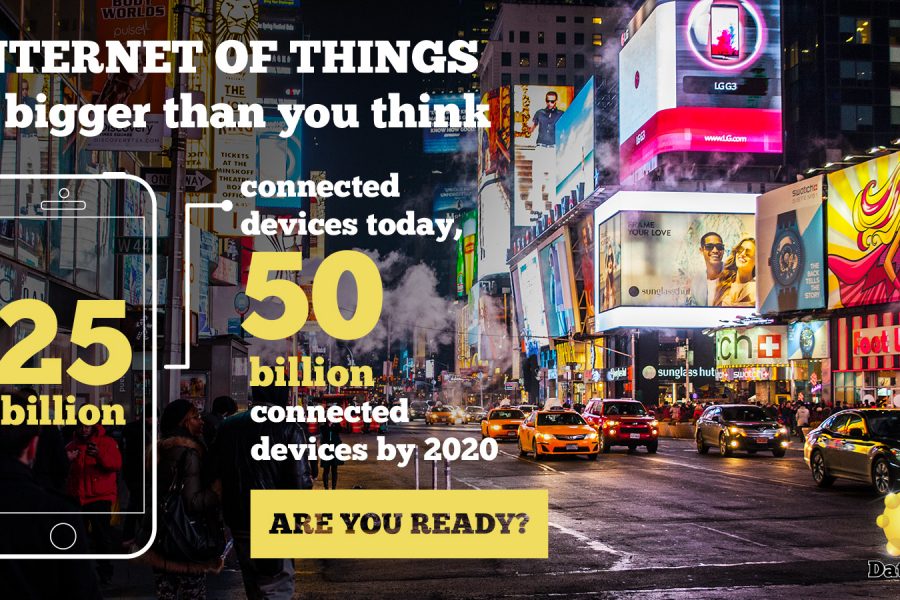
The Internet Of Things The hype about the ‘internet of things’ is hard to escape right now, as more and more everyday objects, from watches to cars, to fridges, begin

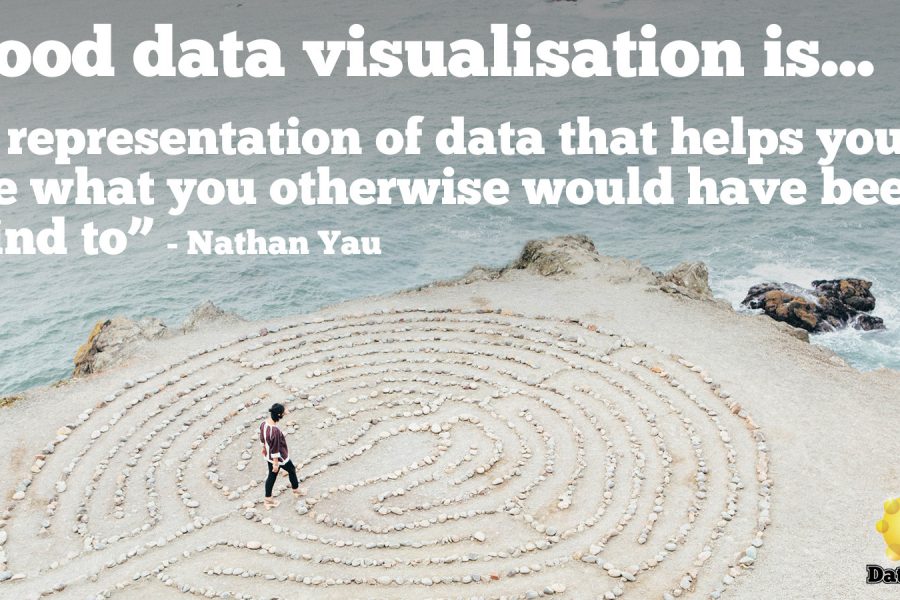
What is Good Data Visualisation? An Infographic We think Nathan Yau of flowingdata.com gets to the heart of why we visualize data – data visualization helps us make and share

Celebrated publisher Joseph Pulitzer spoke these words over 100 years ago, but they’re as relevant today as they ever were. In fact, we think they’d be a great mantra for