

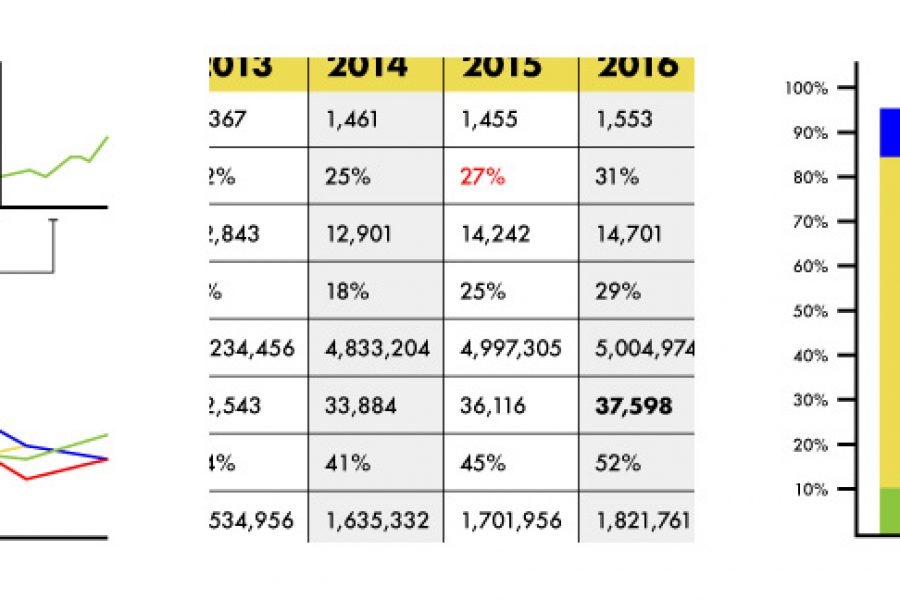
Stop using tables in your reporting. Seriously, there are better ways to visualize data. Here are three: »
See 3 great tips for designing dashboards. Learn the strategic approach to visualizing your data through dashboard systems designed for humans.

Data Visualization Websites — 101 of the Best Resources Ideas, inspiration blogs, people, tools, and more! We’ve searched and searched to bring you 101 data visualization websites that showcase the
What Is The Business Case for Infographics? How You Prove The Value In Better Communication, Information Design & Reporting Your business has data and information. And your business needs to

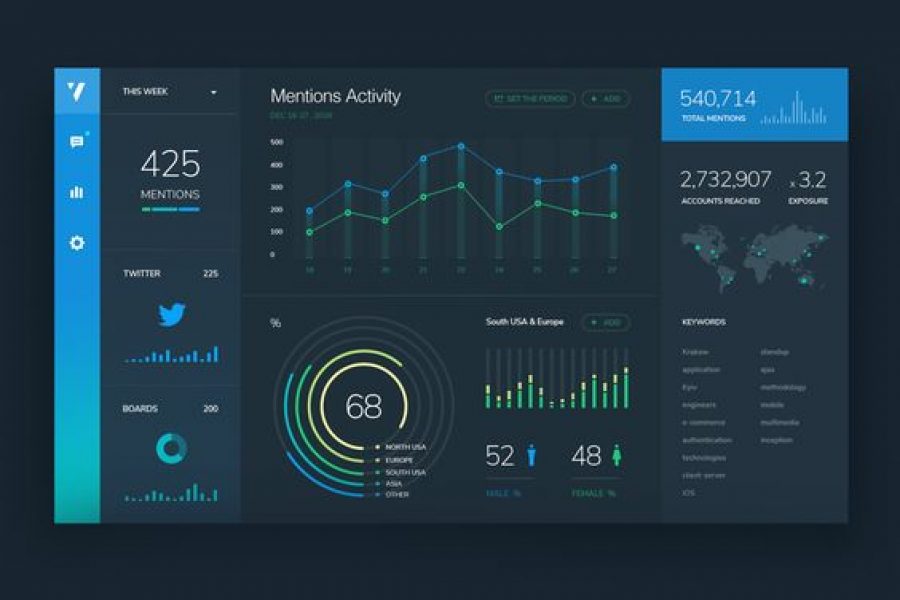
How Do Professional Data Visualizers Design Business Intelligence Dashboards? Most professionals aren’t trained data visualizers. You might be a business analyst, data scientist, or an expert in another field who

6 Examples of NPS Charts: How to Best To Visualize a Net Promoter Score Love it, hate it (or neither…) – Net Promoter Score (NPS) is a key success measure

How to Tell a Story With Data Visualization Ideas and examples you can use in your organization to create a data-driven narrative The idea of collecting and storing massive amounts

Telling Stories With Data: From Simplification to Persuasion and Reporting. The Most Common Questions From Our Data Visualization Workshops. We can run our Data Visualization Workshops anywhere in the world,
8 More Common Types of Data Visualization Following up on our previous list of 15 Types of Data Visualization, which you can find here, we’ve come up with 8 more
What Makes for Great Data Visualization and Why? Data visualization can be a powerful way to communicate. When done right, it delivers information with both the weight of respected research,