light_logo_mobile

Workshops, Dashboard Design, & Creative Reporting

Data Visualization Consultant & Trainer

A data visualization consultancy specializing in dashboard design, training workshops, infographic reports, and BI style guides.

Australia, USA, Europe, & the Middle East

Practical, effective training for corporate and government teams

Data Visualization & AI Training Workshops

Image

The Best Training Workshops

See the type of team training we do.

Intro to Data Viz workshop training

Intro to Data Viz & Storytelling Workshop

Learn the fundamentals and advance to the next level.

Dashboard design training for teams

Designing Great Dashboards

Learn a better way to design dashboards, no matter the software.

Illustration of a robot, visual for artificial intelligence consultancy

Explaining AI Decisions to Stakeholders

Learn to communicate AI insights.

A data agency for creative BI & AI design...

A Data Visualization Consultancy for Communications Design

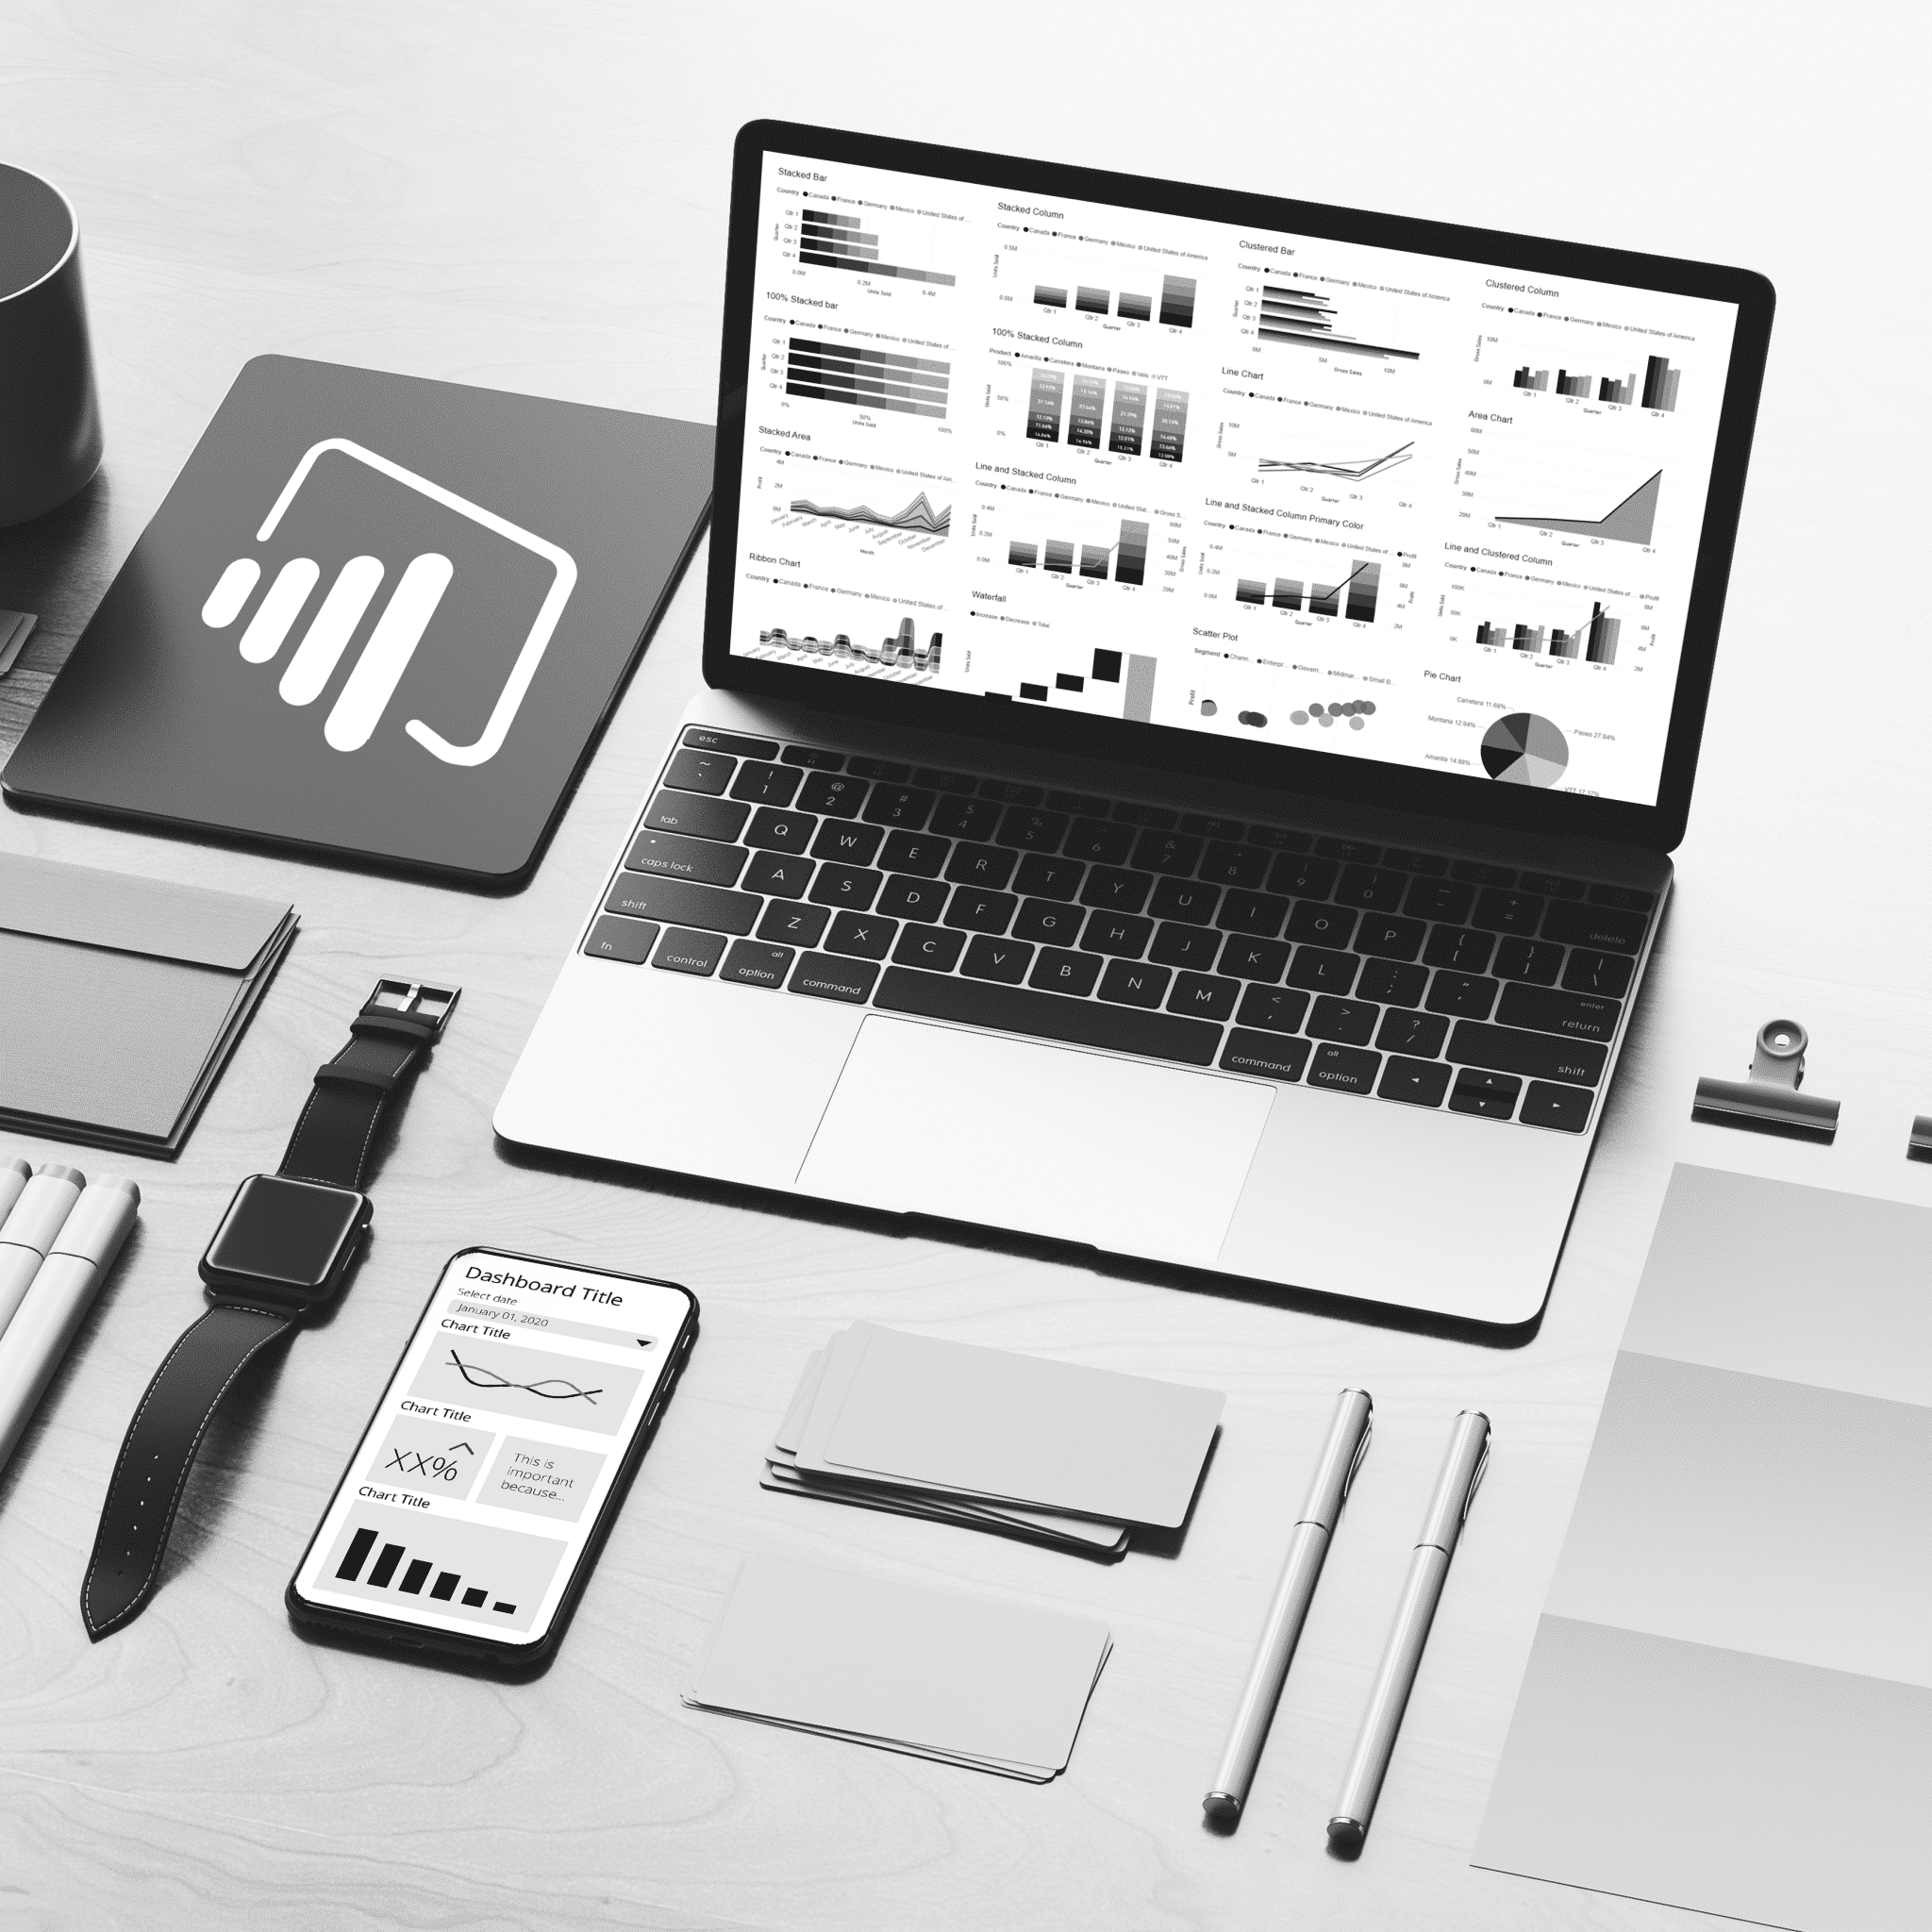
The Datalabs Agency designs data visualization style guides, dashboards, and reports for Power BI, Tableau, and other digital formats.

Brand guidelines for dashboards and reports in Microsoft Power BI
Get professional training on designing business intelligence dashboards.
Skill-up with a creative Power BI design workshop.
Get the best dashboards and BI assets for you Power BI data.
Tableau design guidelines for all your future BI dashboards
Learn professional dashboard design with our online course.
We design and develop the best dashboards using Tableau.
Hire our data visualizers on contact or on a per-project basis.

Data visualization, communications, & storytelling professionals...

A Data Visualization Consultancy Serving All Industries

Data visualization, visual communications, and dashboard strategy — for financial services, government, pharma, manufacturing, media, and more.

Experience the best in reporting, analytics, & training...

Corporate & Government Training in Data Visualization

We’re not a boring IT consultancy. We’re creatives at our core, ones who can talk in everyday language about what excites us about data visualization. We’ve seen hundreds of projects, and we’ve seen the design and thinking mistakes that happened before we were on the job. That’s why we started training. That’s also why we’ve designed our 16 data visualization workshops and online courses: To impart what we know, what we do, and how we do it to a whole new generation of professionals.

Global Sales Analytics
Mercedes-Benz
Image of a car, symbol of the sales dashboards the data visualizer Otto Ottinger designed
Stuttgart, Germany
Revenue Dashboards, APAC
Mariott Hotels
Image of luxury hotel landscape design
Hong Kong, SAR
Silicon Chip Manufacturing
Intel
Visualization of a silicon chip design from San Francisco, California
San Francisco, California
Visualizing Procurement Data
Adidas
Photograph of women's athletic shoes from Adidas
Herzogenrauch, Germany

We run training workshops for the reporting formats that companies use today: reports, dashboards, and presentations. We dig deeper into our experience to show what data visualization should look and feel like in sales, marketing, HR, and finance.

Interested in designing your own training program? Get in touch with us and tell us about it.

We can also break down industry data and train companies in the energy, insurance, banking, and healthcare industries. We’re skilled facilitators, offering training in all the major BI and data design software: Tableau, Power BI, Adobe Illustrator, Microsoft PowerPoint, etc.

Interested in rewarding your work-from-home employees? Check out our Shop.

Insights on AI, dashboards, design, & storytelling

Thinking From a Data Visualization Consultant

Read our latest on dashboard design, data storytelling, interactive visualization, and visual communications.

Purchases for analysts, researchers, & data professionals...

Buy Templates, Courses, Themes, & More

Increase your skills & speed up your workflows — check out our templates, online courses, and style guides.

-31% Sale!
Image
Image
Image
Image
Get trained to visualize data and tell better stories.
Original price was: $183.00.Current price is: $127.00.
-31% Sale!
Image
Image
Image
Image
Finally, a course that shows you what you need to know.
Original price was: $183.00.Current price is: $127.00.
Get the best grids, layouts, navigation, and UI components for your dashboards.
Price range: $1,121.00 through $1,972.00
An all-in-one package containing tools, guidance, and assets to design great dashboards
Price range: $426.00 through $1,064.00

Get help for your analysts, managers, & data professionals...

Interested in Working With a Data Visualization Consultant?

  • This field is for validation purposes and should be left unchanged.