

Infographics or infographic reports are used to visually present a company’s or government organization’s key ideas and insights. By using basic principles of design to support the data, we are able to make it more easily accessible to a larger audience of stakeholders. And we won’t do it in a boring way. Reports, metrics, and KPIs will all look better visualized as infographic numbers and shared internally via your company’s intranet, as collateral in meetings, or used to bolster a business case.
Redesign your boring reports. The future of data-driven storytelling and infographic report design is here.
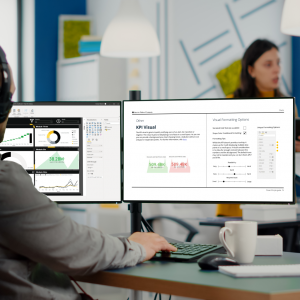
Infographic Reports
What Are Infographic Reports?
Infographic reports are a fusion of infographics, magazine-like layouts, and long-form typography.


Create A Suite of Data-Driven Infographic Reports & Templates


Contact Us Here »
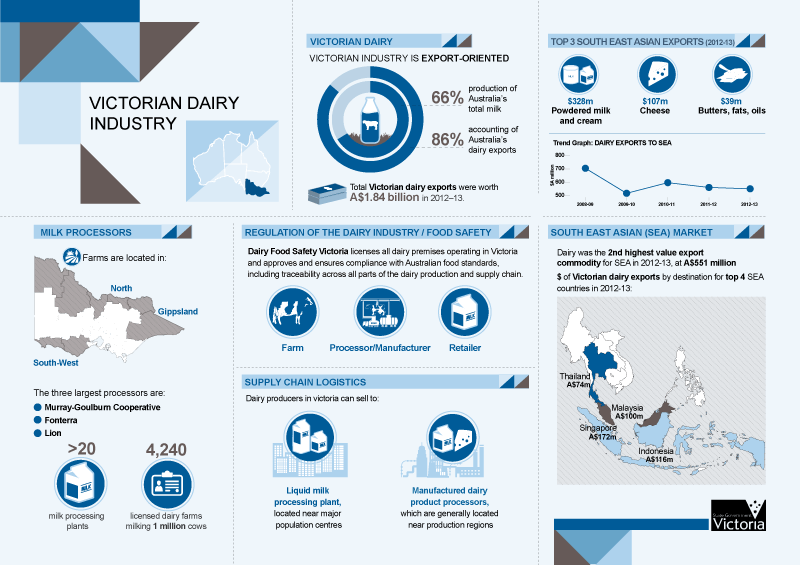
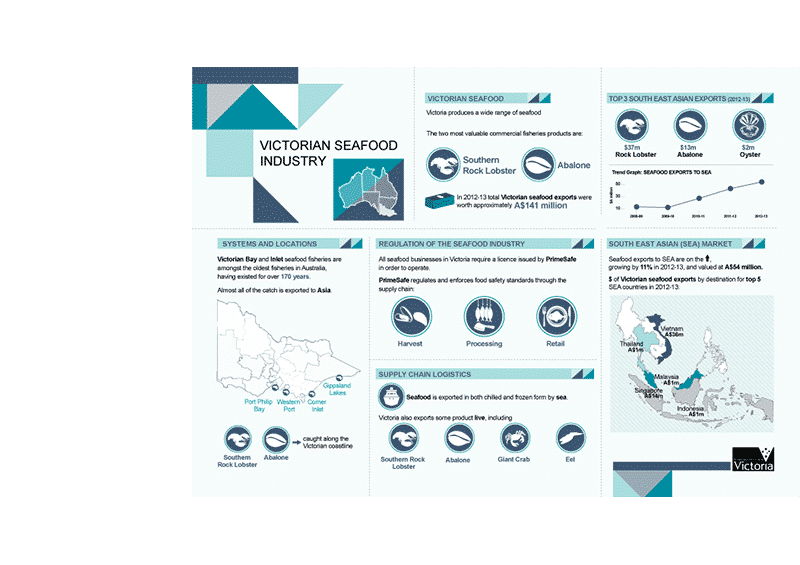
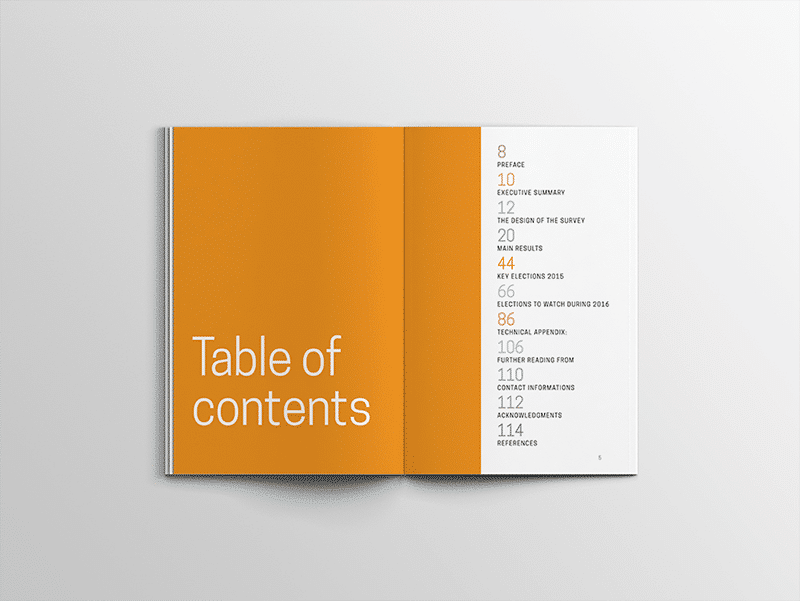
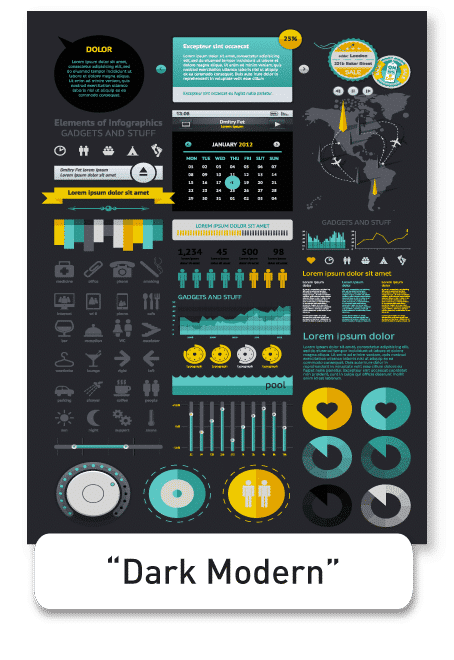
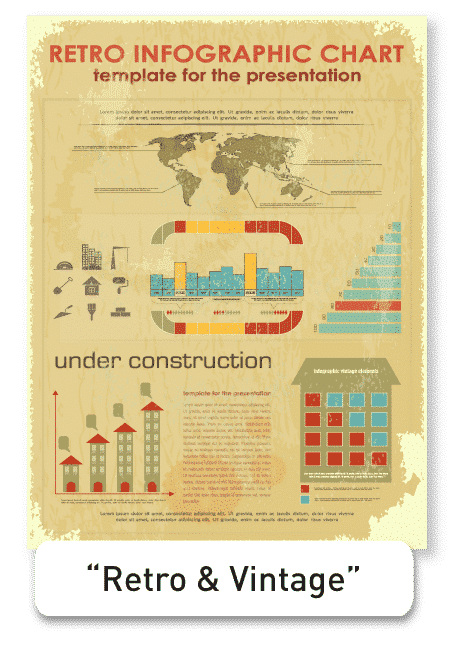
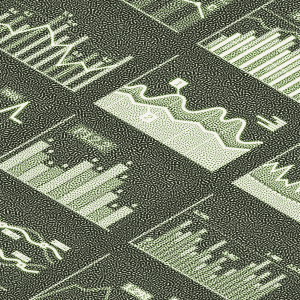
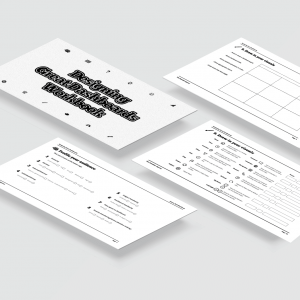
Infographic Report Design Examples For Companies
Below are eight infographic styles to get you thinking. (There are so many more, however.)


We’re not a one-off infographics kind-of company. We help organizations build their strategic capabilities in infographic design. Whether training analysts, marketers, or communications experts in the methods and tools, or building visual communications and reporting strategies, the Datalabs Agency has been doing it since 2011.
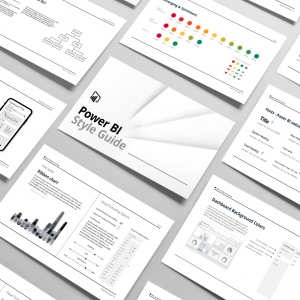
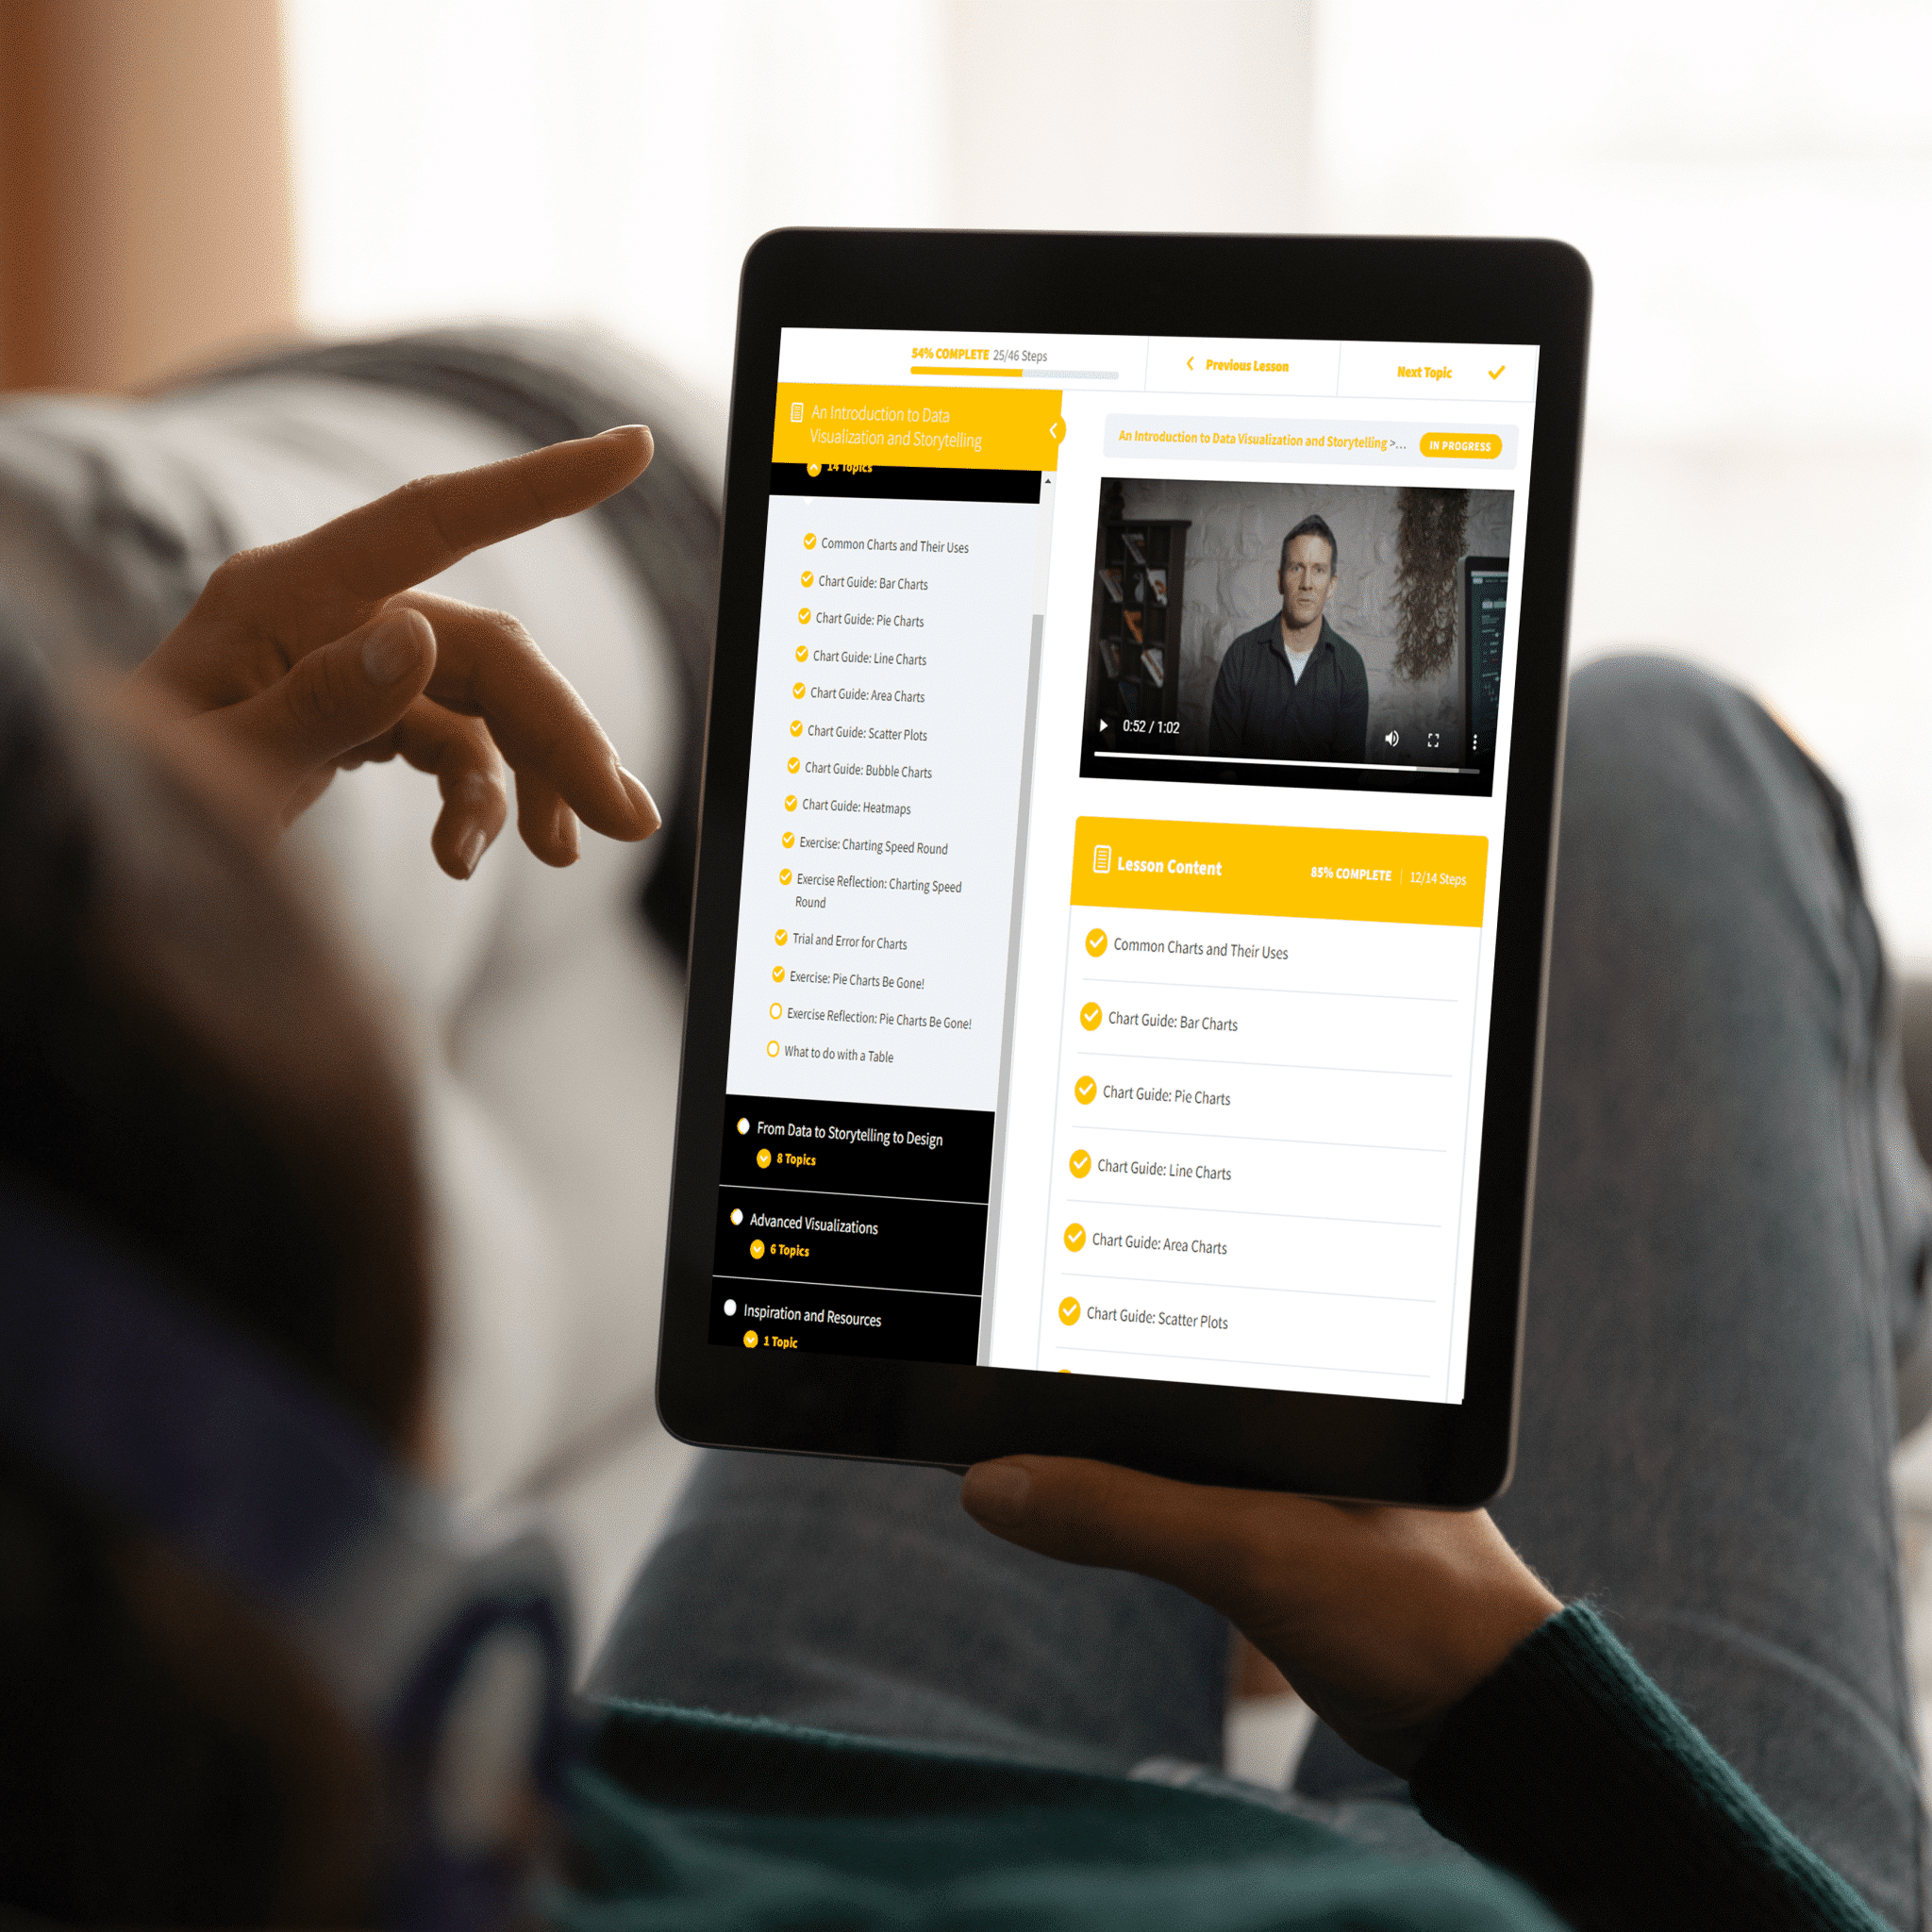
Need training? We run infographics workshops, teaching teams to design reports as we do, using the methods and tool of a modern data visualizer and storytellers. Interested in designing your own infographic reports? Our designers can work with your company to create re-usable templates. Want to design a ton of branded infographics in-house? Get an Infographics Style Guide to get started.
Style Guide


Strategy
Infographic Reporting in the Formats You Know
Our infographics are designed to support or replace your existing business documents. Print them or share them digitally. Infographic reports can be generated as hi-res PDFs or as JPG, GIF, and PNG images.
The Beauty of Infographic Reports
Design your report templates with us, get an infographics style guide, or commission one of our workshops.
Whatever your capability for infographic design, contact the Datalabs Agency to convert your spreadsheets of data and ideas for content into full-blown infographic reports.
Why Infographic Reports?
Six Reasons for Visual Reporting
The Attention Span of Your Reader
Gone are the days when your audience had the time to read your report from cover to cover. Today’s reports are tighter with text, more infographic-ey with visuals.
The Wow Factor
See reports that grab readers’ attention from the front cover to the appendices. We design and develop infographic reports and style guides.
Report Design Has Evolved
We’re influenced by magazine and website design. We love emotive photography and of course, the best data visualization. Reporting can be exciting and beautiful.
From Print to Digital Hybrid to Microsites
We’ve helped companies make the leap off of print into the 21st Century. We develop interactive annual report templates and even reporting microsites.
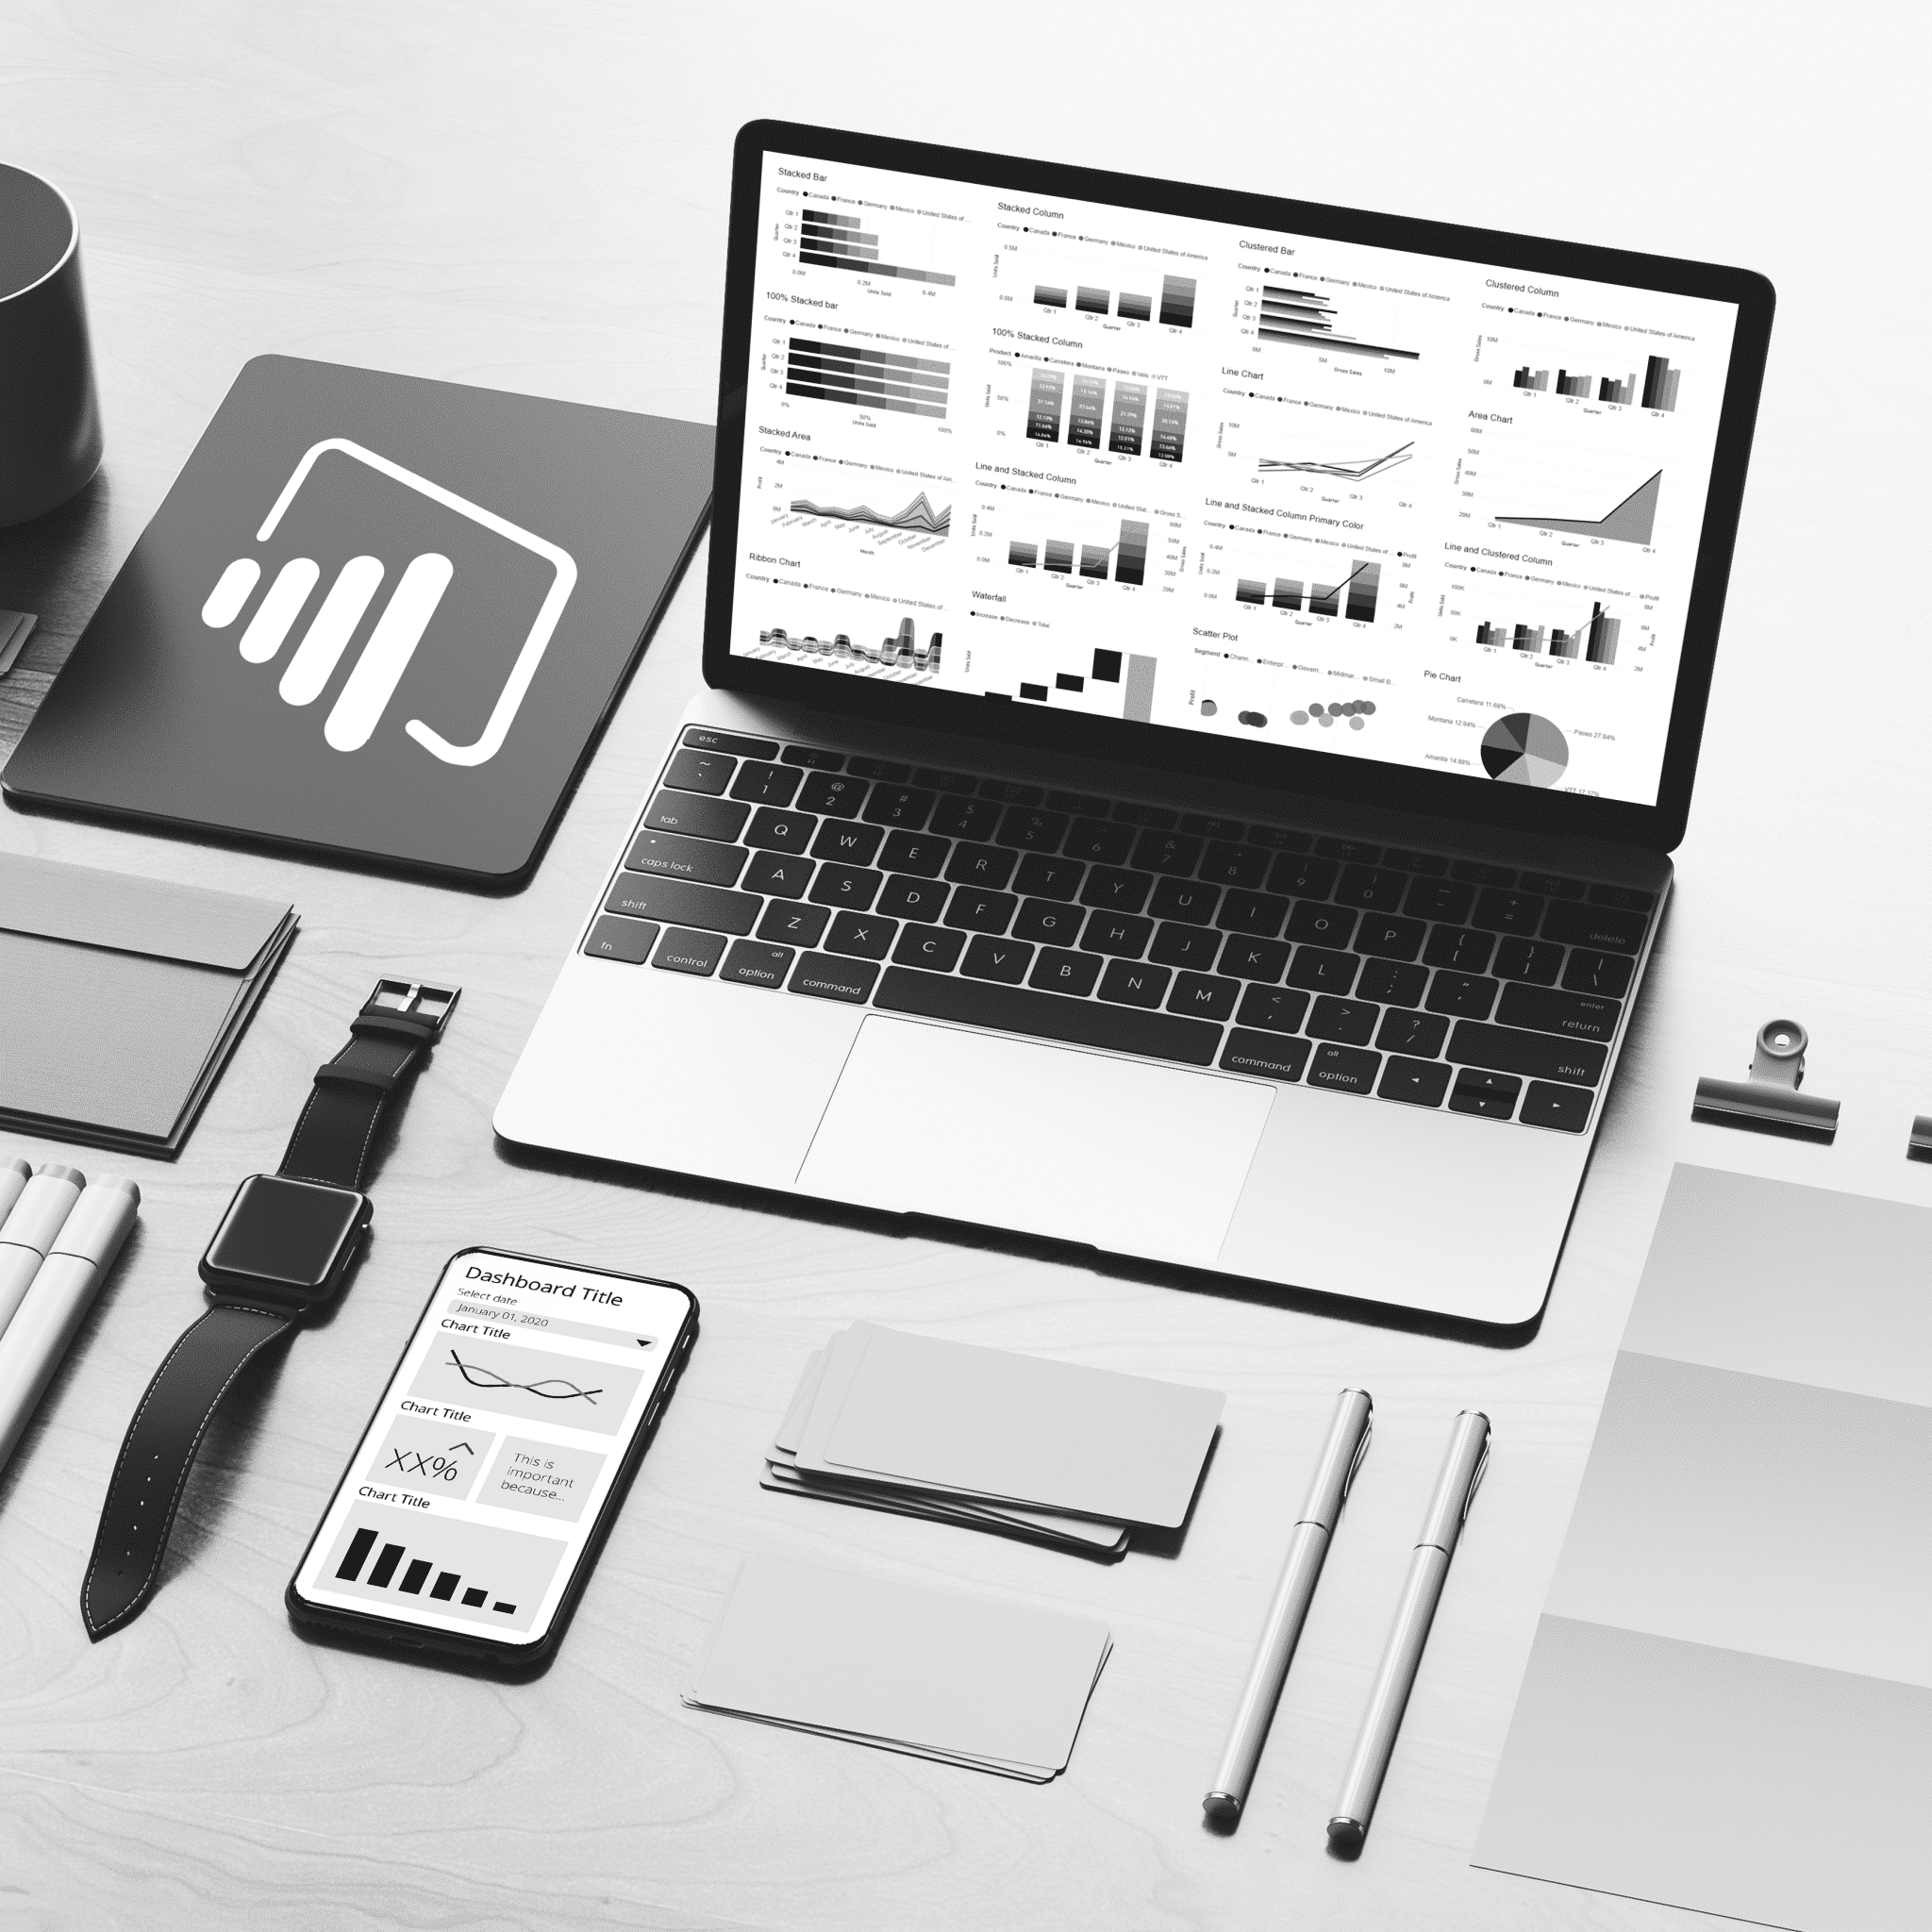
Better Data Visualization
Did your last report show a table of data? Stop right there and give us a call please.
Interactive Reports
Infographic reports can include interactive elements, like links, dynamic data, and animated charts. These aren’t your grandpa’s Word document.
What does Datalabs offer?Infographic style guidesInfographics workshopsVisual communications strategies


WHAT OUR CLIENTS SAY
Since they were called information graphics, the Datalabs Agency has been designing infographics and training the next generation of visual storytellers. Here's a bit of gossip about us, straight from our clients' fingertips.
Level Up In Data Viz!


Get trained to visualize data and tell better stories.
$45
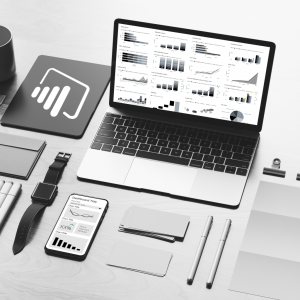
An all-in-one package containing tools, guidance, and assets to design great dashboards
$900 – $3,900