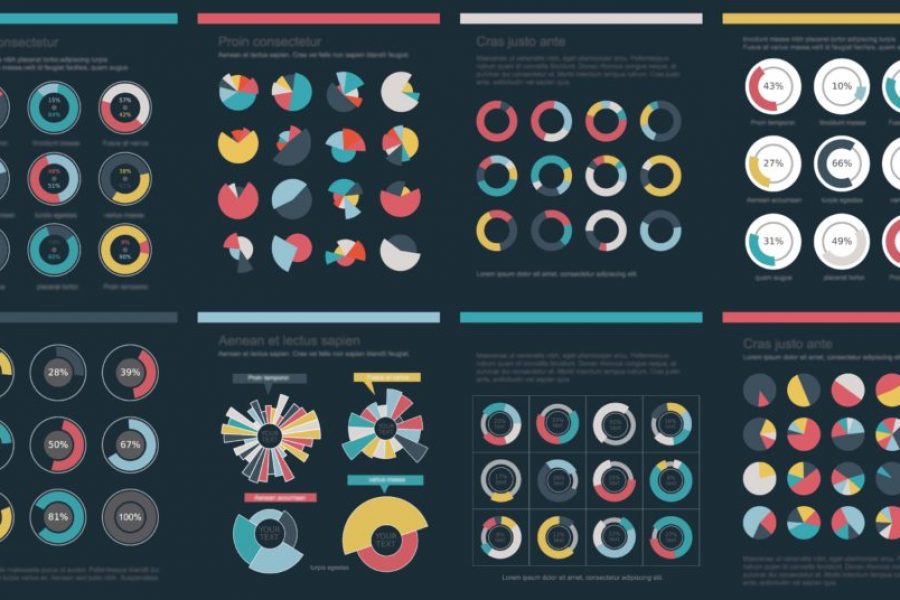
Brand Guidelines for Data: The Data Visualization Format of the Year (First Place) Formatting All Data Visualization with Best Practice Principles In 2023, the visual branding of data has only

Data Visualization Brand Guidelines for Tableau, Microsoft Excel, Highcharts & Infographics As we have seen on projects time and time again, data scientists and data designers have two separate capabilities.


