

A case study on a Tableau dashboard, infographic and data design project for the marketing team at Victoria University.
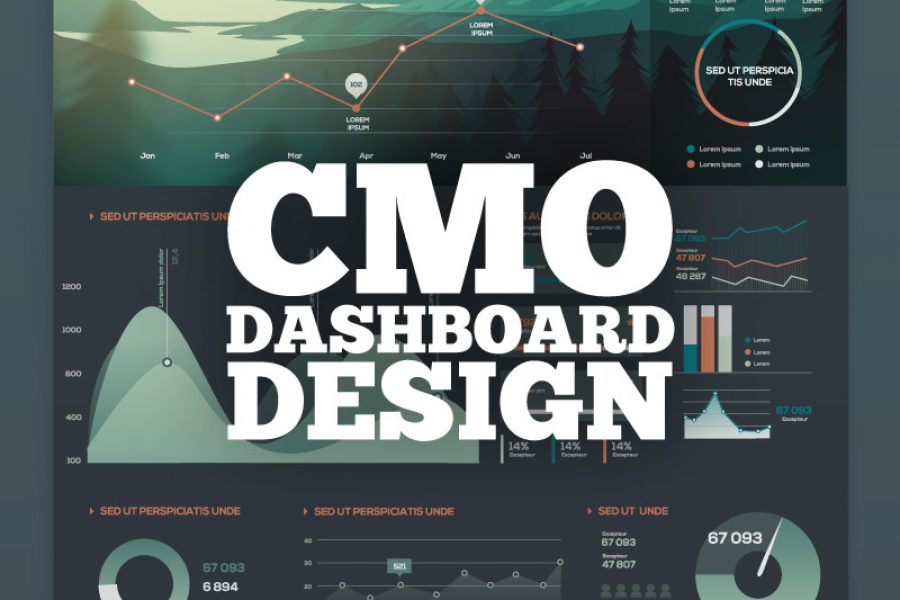
Recruiting a Chief Marketing Officer in a data-driven world isn’t easy. Heads of corporate marketing often rise through the ranks without the scientific or technological background needed today. This presentation
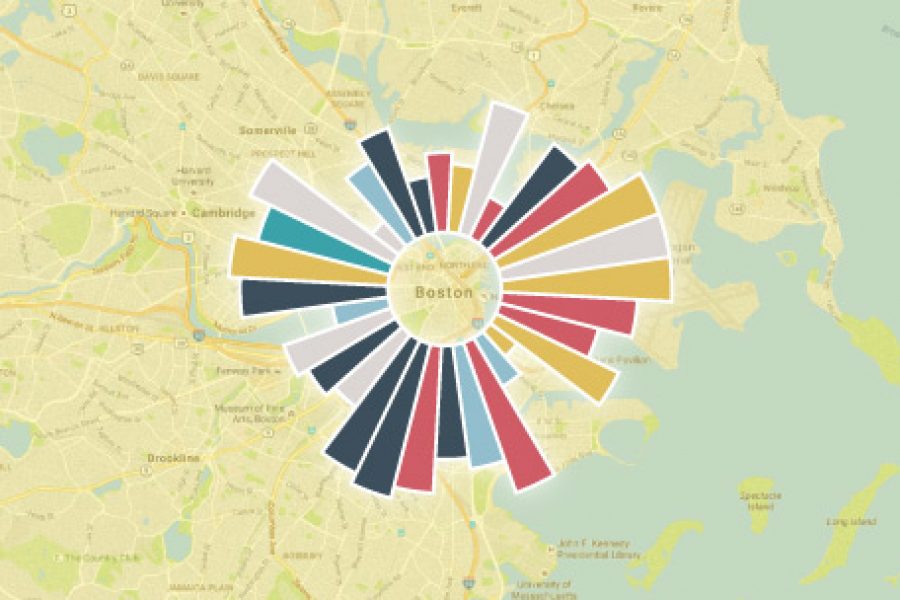
Data Visualization and the Big Three Strategy Consulting and Big Four Accounting Firms How does a creative data visualization and visual analytics agency get along with the ‘suits’? Combing through
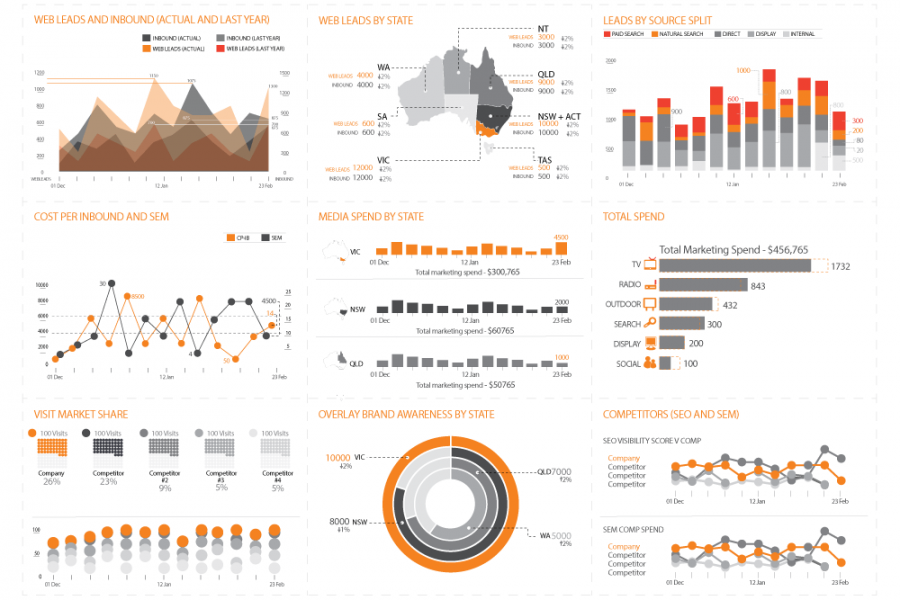
With Datalabs’ help, at a Chief Marketing Officer’s level, reporting is now a unified dashboard — simple and insightful. An online healthcare and insurance company came to Datalabs with a