


See the 2024/2025 guide to the best data visualization conferences in North America, Australia, Asia, and Europe. Use this year's conference guide as a travel planner. So get out, travel, meet new people, and learn more about what makes data visualization such a creative and interesting area to work in.

Six Reasons to Gift Skills Training to Your Employees The Benefits to Both Individuals and Businesses as a Whole At the Datalabs Agency, we’re firm believers in hiring great people

Data Visualization Websites — 101 of the Best Resources Ideas, inspiration blogs, people, tools, and more! We’ve searched and searched to bring you 101 data visualization websites that showcase the

From the dreaded pie chart to the often-misunderstood Sankey diagram, we'll geek out on more data viz guidance, updating this list of categories and types. So bookmark this page and sign up for our data visualization newsletter to keep your data design brain well fed.

10 Data Viz Guys & Gals to Follow on Instagram Want constant #inspo on your #insta? Follow these awesome data visualizers to keep you motivated. 1. Mona Chalabi Mona Chalabi

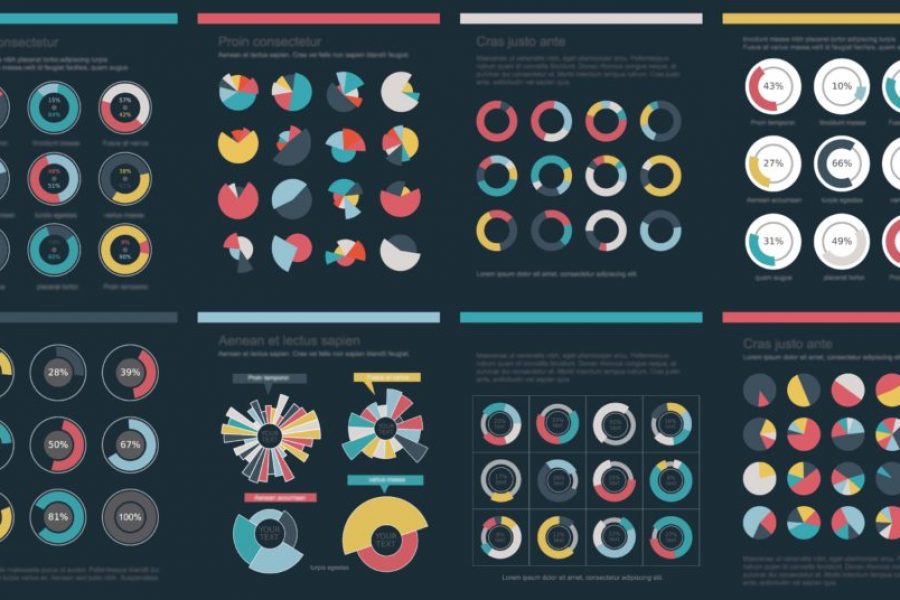
There are some tricks to making your data viz understandable and memorable, that is, by using repetition, alignment, and symmetry to your advantage.

The Use of Repetition, Alignment, & Symmetry in Data Visualization Design shows in clear examples how these design principles can be use in data viz and infographics. Learn something new.
Brand Guidelines for Data: The Data Visualization Format of the Year (First Place) Formatting All Data Visualization with Best Practice Principles In 2023, the visual branding of data has only

Looking for a freelance infographic designer to hire? See our work here at Datalabs. About the Infographic Designer role: Our Infographic Designers are the agency’s creative visualisers and graphic designers,

How Do Professional Data Visualizers Design Business Intelligence Dashboards? Most professionals aren’t trained data visualizers. You might be a business analyst, data scientist, or an expert in another field who

2021 is the year of the accessible conference. More summits, forums, events can be accessed either completely or partially online. We're going virtual, baby! Now's the time to take advantage.