

The Data Visualization Format of the Year (Runner Up): The Interactive Map With best-practice examples You may have already seen that this year’s best data visualization format winner was declared:
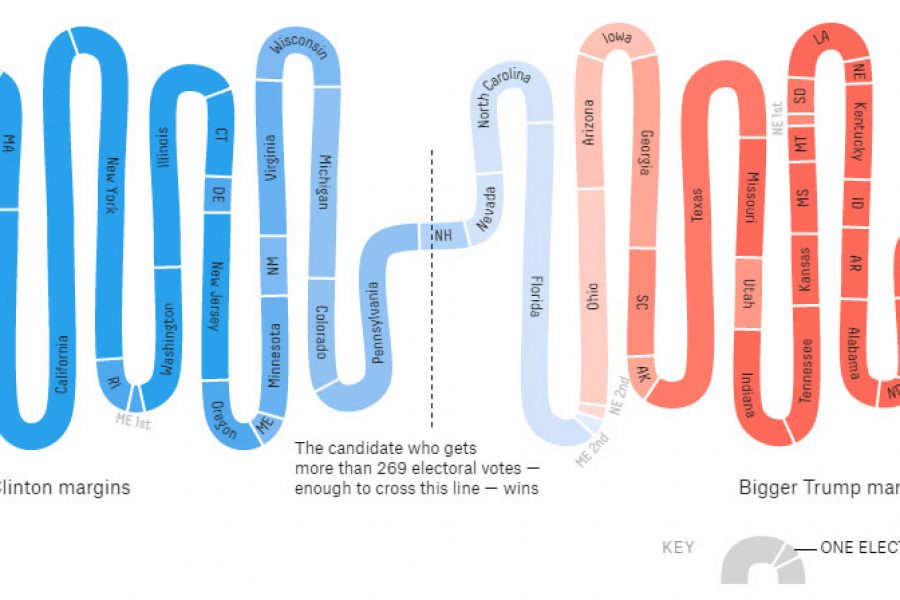
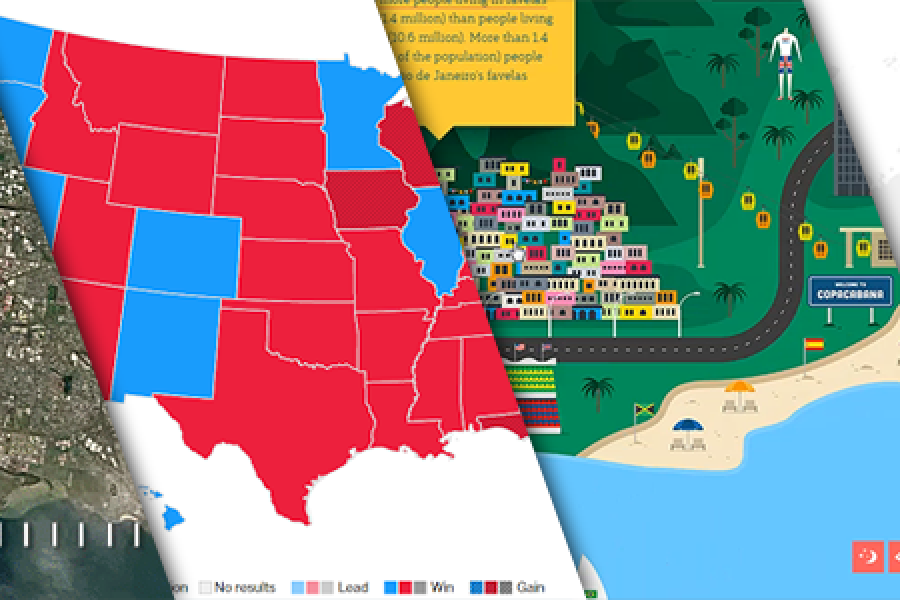
With the dust now beginning to settle, let’s take a different look into the past US Election… Politics and outcomes aside, American elections bring with them an enormous responsibility to

All industries have a critical need for visual analytics. The insights that can come immediately from a well-designed business dashboard or data visualization in the finance industry could provide the