

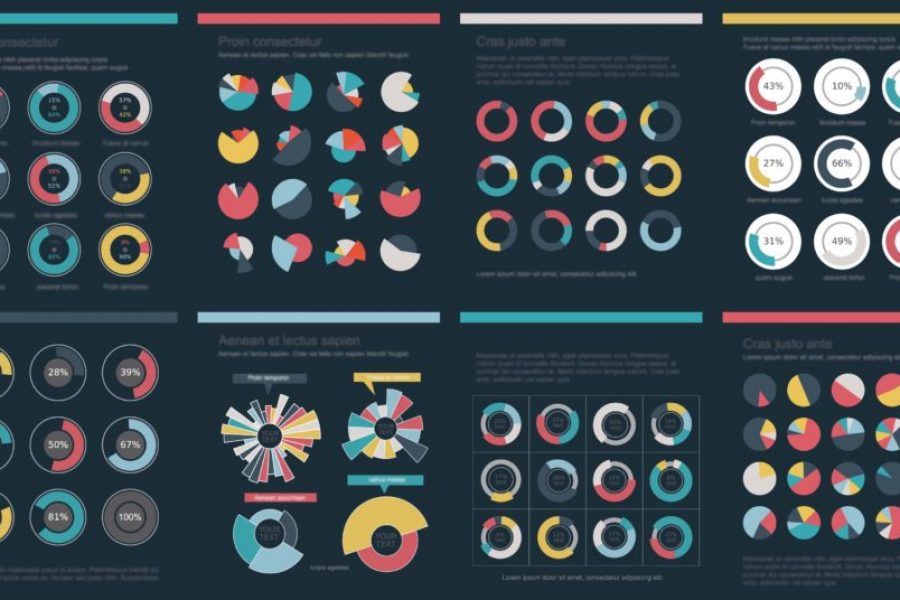
Brand Guidelines for Data: The Data Visualization Format of the Year (First Place) Formatting All Data Visualization with Best Practice Principles In 2023, the visual branding of data has only

All chief executives have one thing in common – they need more TIME. There never seems to be enough hours in a day! Between meetings, conference calls, replying to emails
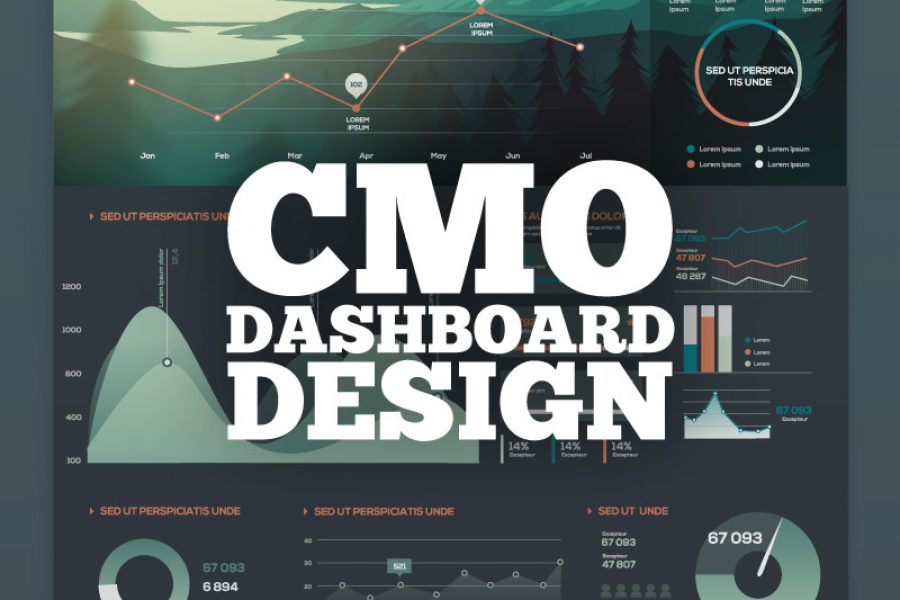
Recruiting a Chief Marketing Officer in a data-driven world isn’t easy. Heads of corporate marketing often rise through the ranks without the scientific or technological background needed today. This presentation
“A Golden Age of Interface Design is coming. The creative and visual direction of data design can be inspiring and creative. Let’s make sure it is. Here’s a vision and
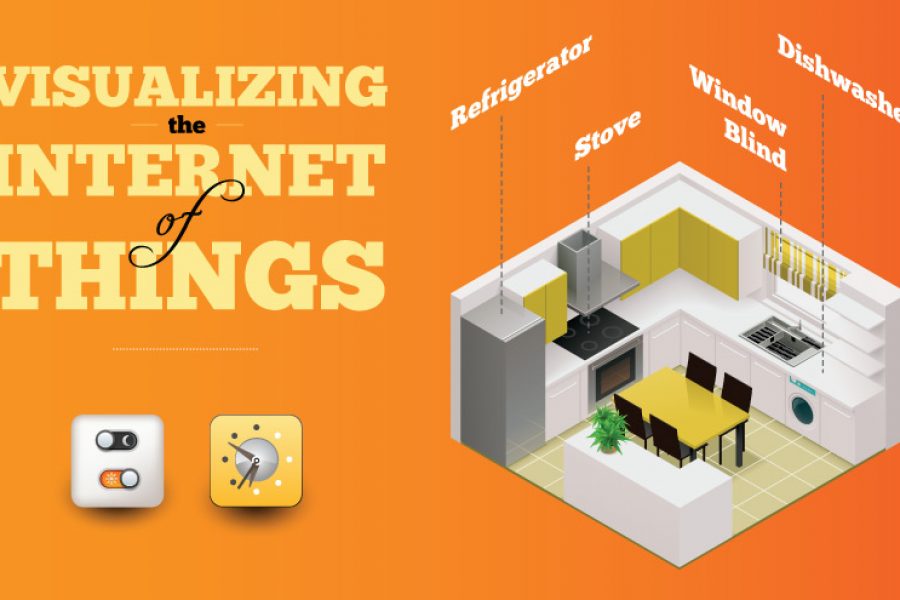
No Chief Data, Chief Digital, or Chief Marketing Officer will be spared the deluge of data coming from the Internet of Things (IoT). I propose the challenge initially isn’t a