

See 3 great tips for designing dashboards. Learn the strategic approach to visualizing your data through dashboard systems designed for humans.

What is Explainable Artificial Intelligence (XAI)? A New Design Frontier in Machine Learning As smart algorithms, artificial intelligence and machine learning applications are finding its way into our daily lives,
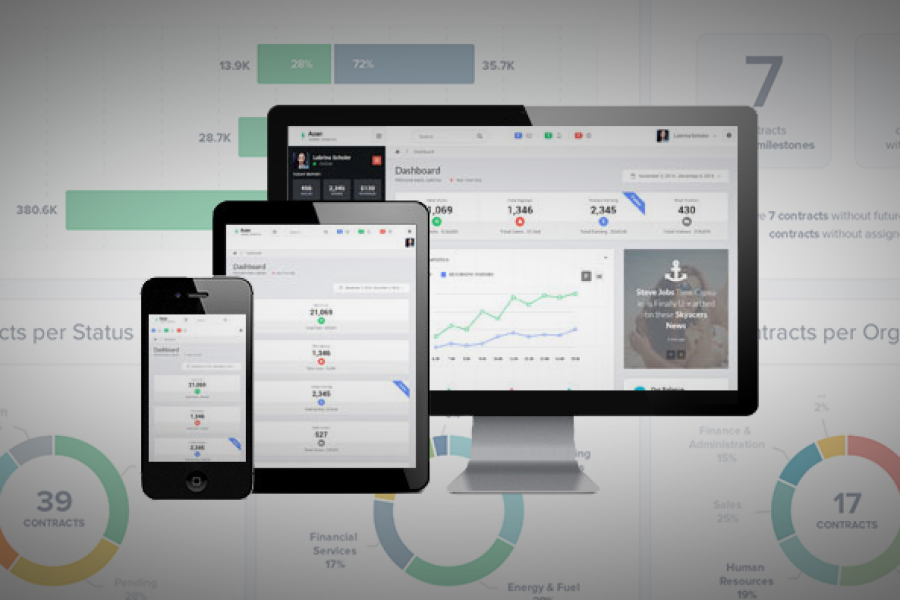
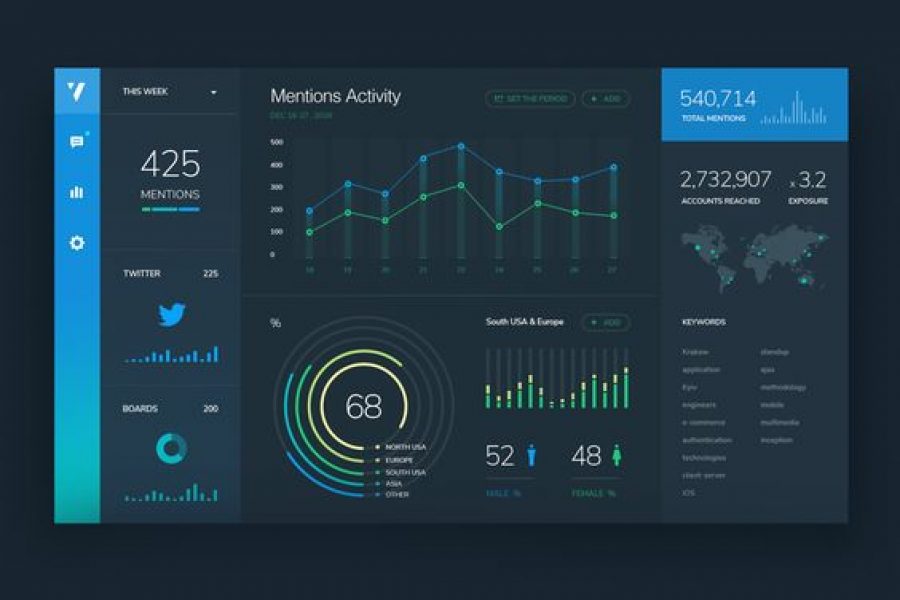
6 of the Best Marketing Dashboards … And Why Your Business Needs One! Tired of tiny details and endless numbers on your marketing strategy report? Tired of constantly opening new tabs
“A Golden Age of Interface Design is coming. The creative and visual direction of data design can be inspiring and creative. Let’s make sure it is. Here’s a vision and
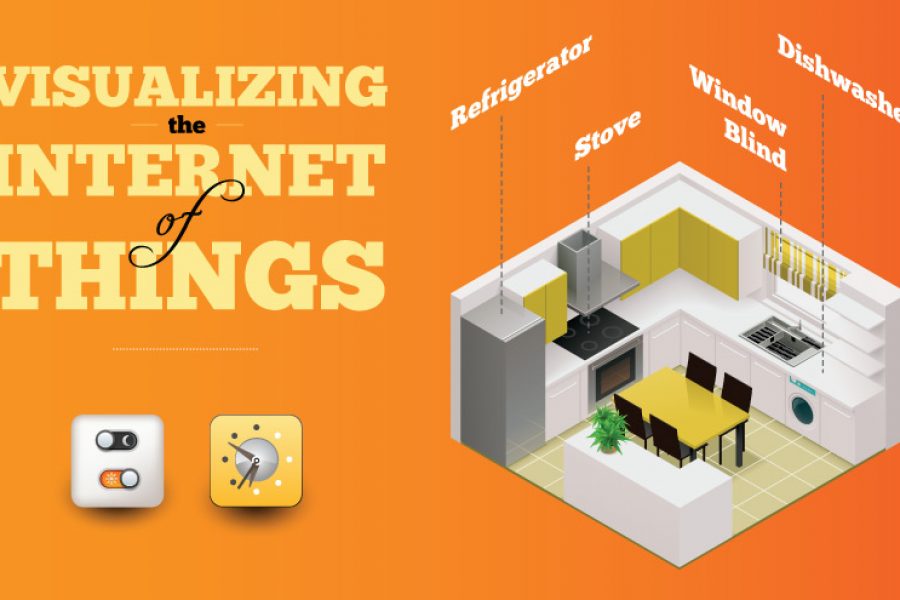
No Chief Data, Chief Digital, or Chief Marketing Officer will be spared the deluge of data coming from the Internet of Things (IoT). I propose the challenge initially isn’t a
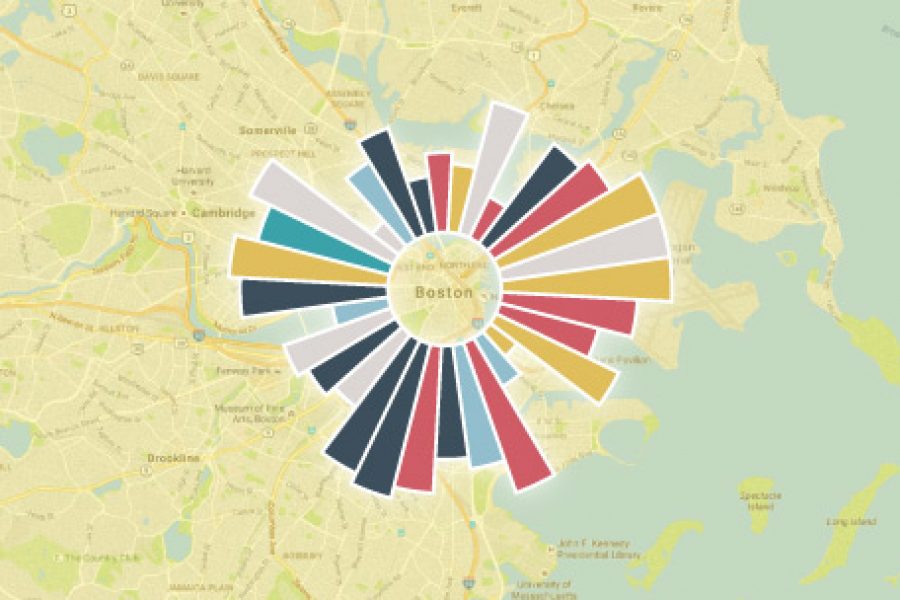
Data Visualization and the Big Three Strategy Consulting and Big Four Accounting Firms How does a creative data visualization and visual analytics agency get along with the ‘suits’? Combing through
Empowering Employees to Make Better Decisions Through Visual Analytics. “Seeing is believing, but sometimes the most real things in the world are the things we can’t see”, – The Polar