

Data Visualization Brand Guidelines for Tableau, Microsoft Excel, Highcharts & Infographics As we have seen on projects time and time again, data scientists and data designers have two separate capabilities.
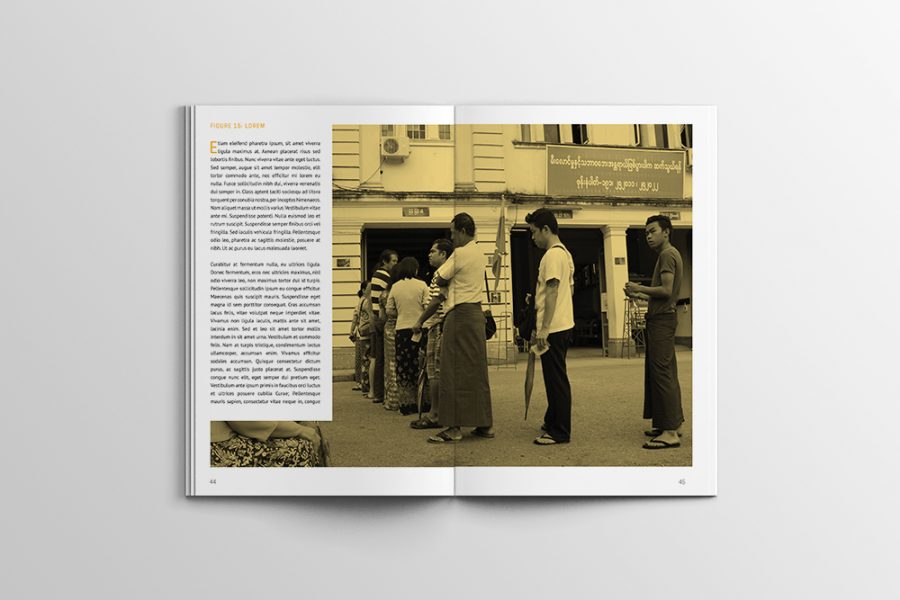
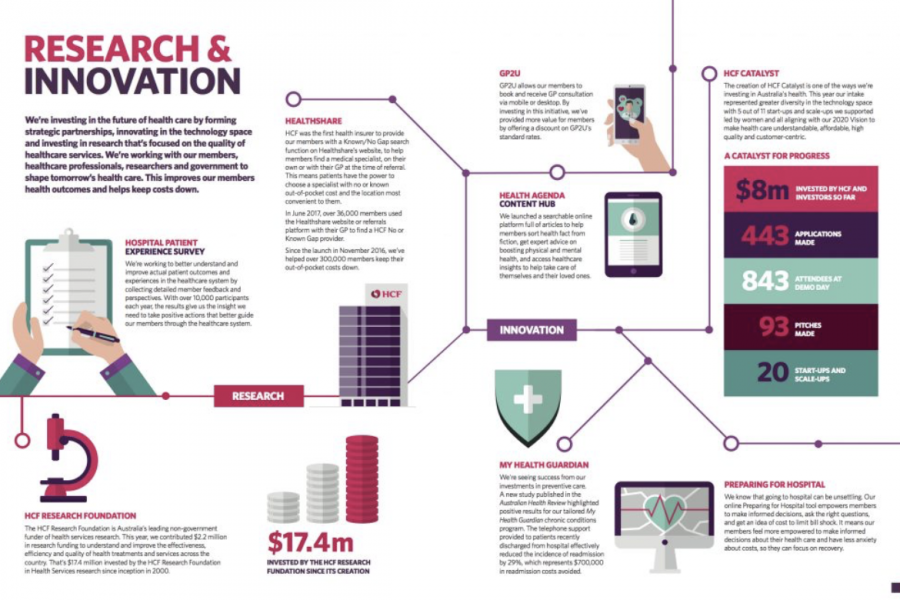
Case Study: A Long Infographic Report Design We recreated a long research report with an infographic style, using charts and graphs to convey the data they’d collected, over the period

Excel Data Visualization Artwork Project. Creating beautiful, artistic work exclusively in Excel. We were tasked by a digital agency to create something different for their client, using only the Microsoft product