

Looking for a freelance infographic designer to hire? See our work here at Datalabs. About the Infographic Designer role: Our Infographic Designers are the agency’s creative visualisers and graphic designers,
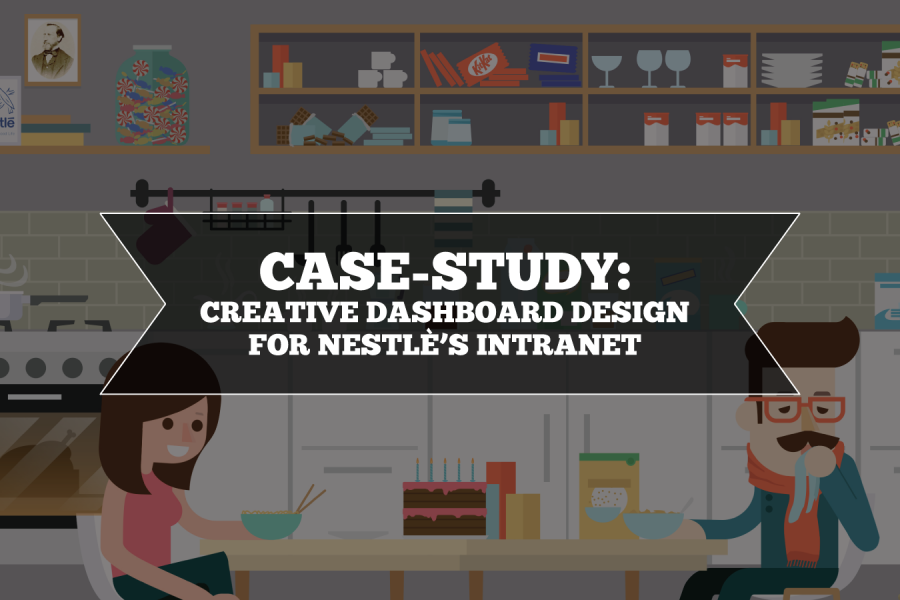
Nestlé's aim was to develop an easy-to-use, visually engaging experience that would help to make Nestlé employees’ jobs easier, and therefore, more enjoyable. The Datalabs Agency designed and developed a fun Intranet portal in response.
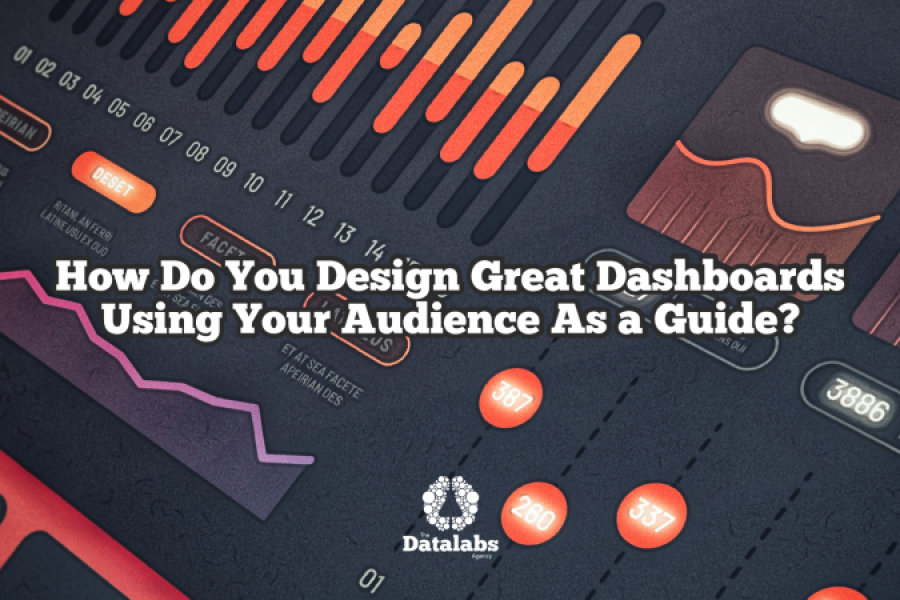
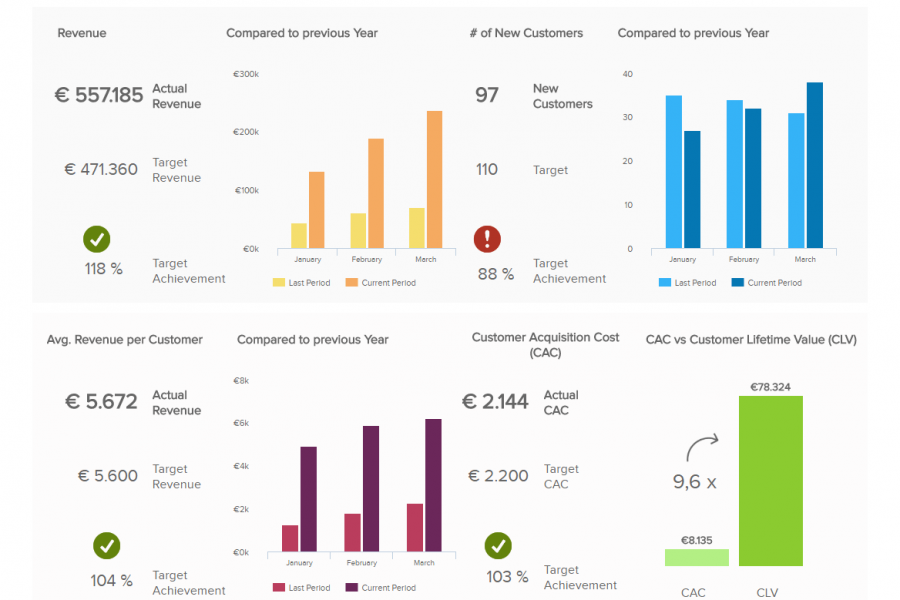
To design for specific dashboard users and audiences, you need a process. The Datalabs Agency uses a 12-step process to design its dashboards. 12 sequential steps or tasks that
How Do Professional Data Visualizers Design Business Intelligence Dashboards? Most professionals aren’t trained data visualizers. You might be a business analyst, data scientist, or an expert in another field who
What do you think about the current methods of Covid-19 contact tracing? Where I live, it seems to be paper-based, paired with a non-functioning mobile app that gives me a
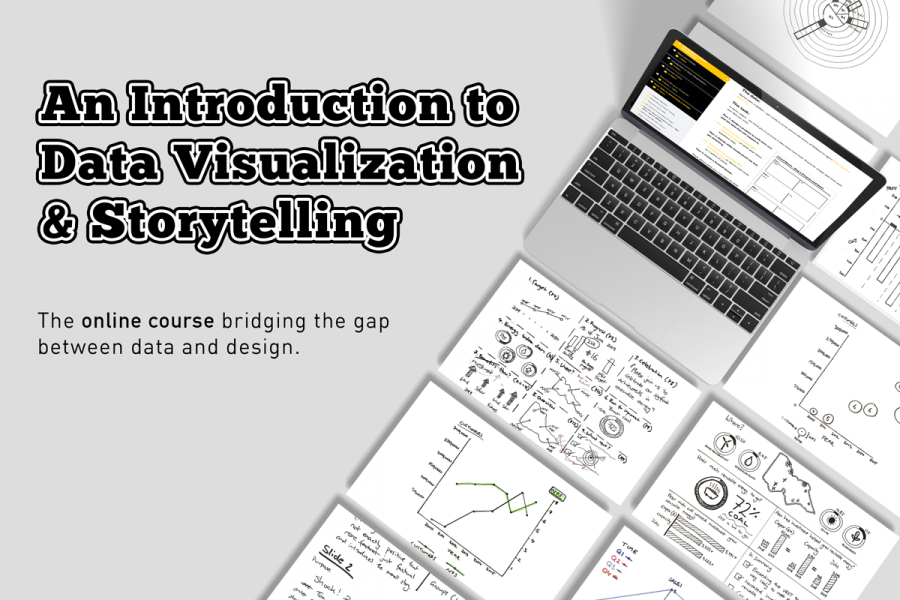
The Datalabs Agency has NEWS! Online Data Visualization and Storytelling Course Launch Hello, data friends! Click here for the “Introduction to Data Visualization & Storytelling Course”. We’ve been working hard
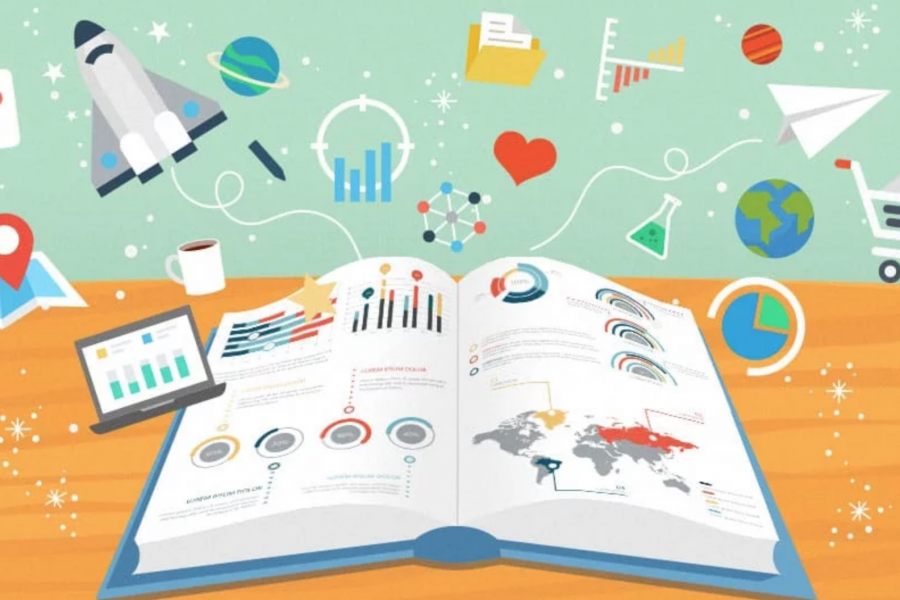
The Key to Data Storytelling: Creating Captivating Dashboards & Infographics “Those who tell stories rule society.” – Plato In the past, the role of a data scientist or analyst is simple

Design Thinking Meets Data Science The term “Big Data” has gained lots of attention in recent years. Want to know what the sexiest job of the 21st century is? It’s
The Future of Marketing Analytics The digital revolution today has brought disruption. Marketers have to think smart – and fast. Combined with the increasing and always-changing consumer expectations, decisions have
Our Data Visualization Basics A Data Visualization Primer Let’s look at some data visualization basics. In today’s technologically advanced age, we are overwhelmed with data every day – not all

Tableau Launches Four New Exciting Features If you haven’t figured it out, we are OBSESSED with data visualization, dashboarding, and data discovery. One of our favorite BI tools, Tableau, recently
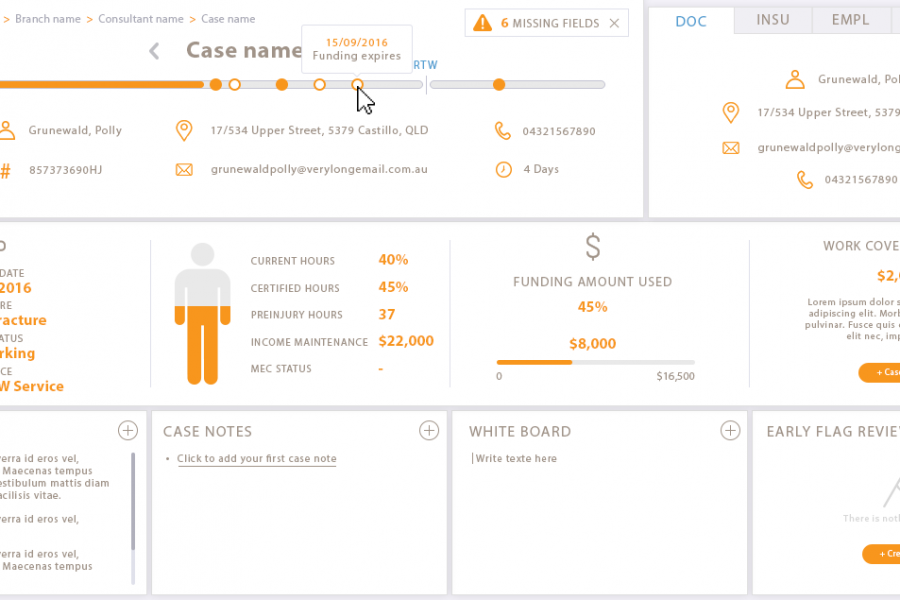
Our client engaged Datalabs to design a best-in-class dashboard and user interface for their frontline staff’s main workstation. Check out the infographic look in this data visualization case study.