

Editor’s Note – We’ve got an updated list with 2016’s the new dates and other great events here: Data Visualization Conferences 2016 With the new year coming up, and new travel budgets
What is the Business Case for Data Visualisation? Data is ubiquitous these days, but it wasn’t always that way. Data collection used to be limited to hand-written records and/or oral

The Need For Data Visualisation Skills In Business A guide to skilling-up your employees An SAP-sponsored survey recently questioned business leaders about their opinions regarding the uptake and effectiveness
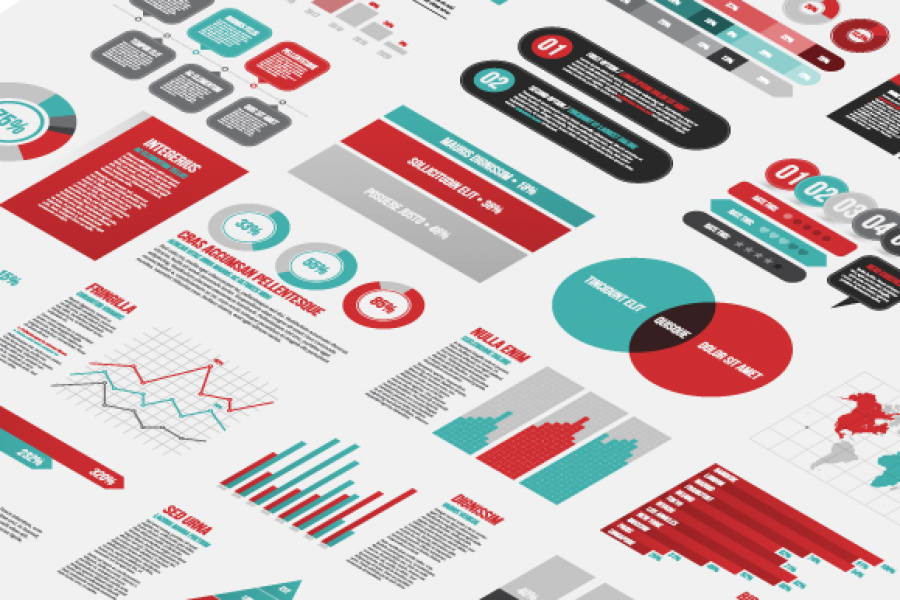
Salespeople and their managers are extremely time-poor and extremely focused on their job: selling. They don’t have a lot of time to read through endless sales reports or to click

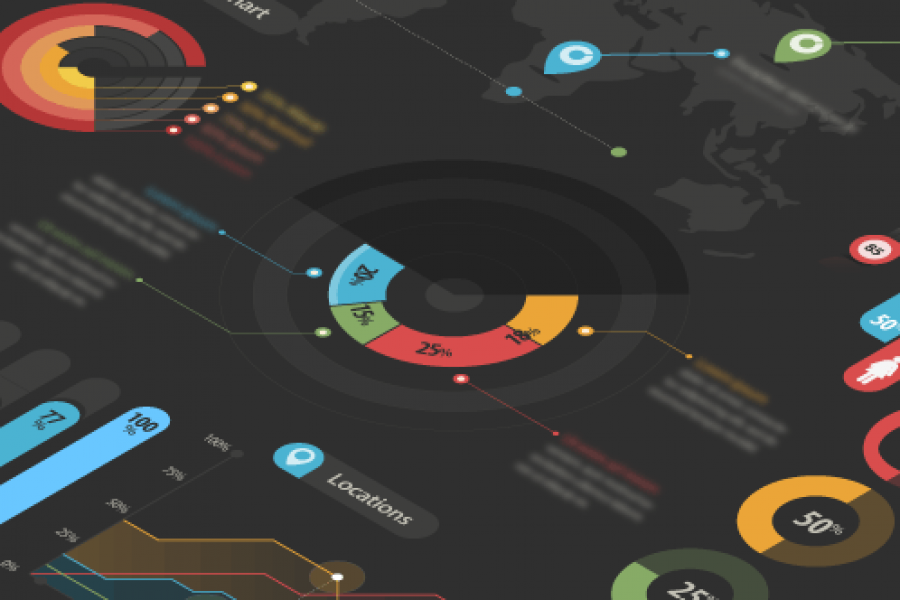
All industries have a critical need for visual analytics. The insights that can come immediately from a well-designed business dashboard or data visualization in the finance industry could provide the
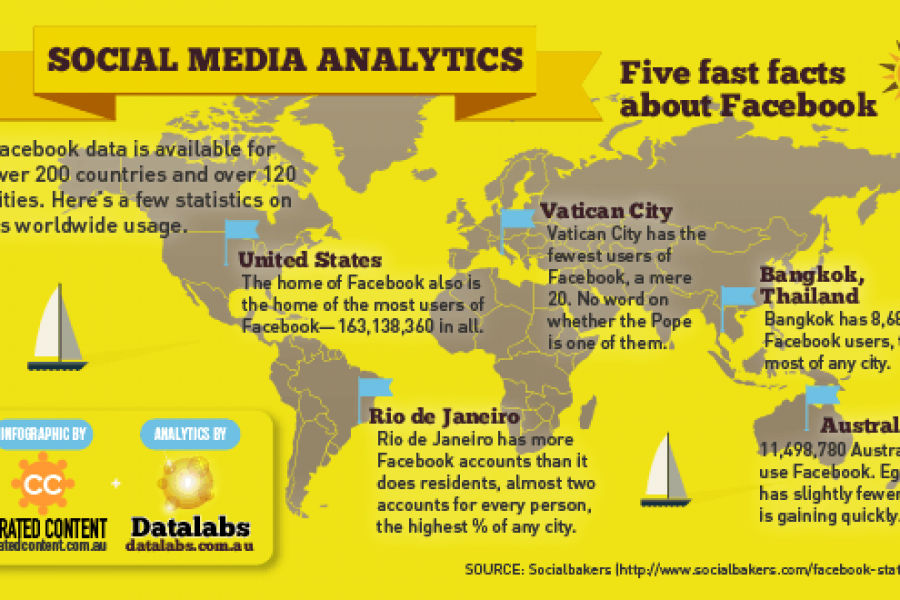
Facebook data is available for over 200 countries and over 120 cities. This infographic shows a few statistics on its worldwide usage. Click the image above to see a PDF version