hello@datalabsagency.com
logo
Datalabs Agency
En
  • De
  • Ar
0
logo
  • Data Training
    • Our Six Main Workshops
      • Introduction to Data Visualization: Tools & Techniques Workshop
      • Designing Great Business Dashboards Workshop
      • Infographics & Report Design Workshop
      • Creative Data Presentations with PowerPoint
      • Visual Storytelling for Government Workshop
      • Creative Power BI Dashboard Design
    • Online Courses
      • An Introduction to Data Visualization & Storytelling
      • Designing Great Dashboards
  • Data Design
    • Style Guides
      • Power BI Style Guides
      • Tableau Style Guides
    • Animated Data Videos
    • Maps & Cartography
    • Interactive Infographics
    • Power BI Dashboards Designs
    • Tableau Dashboards Designs
    • Infographic Reports
    • Interactive Data Visualizations
    • Digital Annual Reports & Microsites
  • Case Studies
  • Shop
    • Ecommerce Products
      • Power BI Templates
      • Power BI Theme and Style Guide
      • An Introduction to Data Visualization and Storytelling Course
      • Designing Great Dashboards Course
      • Data Visualization Consultant
  • Login
  • Contact
    • About
      • Otto Ottinger
      • Blog
Will the Internet of Things benefit our lives? 83 percent of experts say yes. 0
Will the Internet of Things Benefit Our Lives?
02 April 2015
0
What to Look for in a Data Visualisation Agency?
23 April 2015
Articles
The Internet of Things Growth
April 14, 2015 by Datalabs in Articles

The growth of the internet of things - it's bigger than you think

The Internet Of Things

The hype about the ‘internet of things’ is hard to escape right now, as more and more everyday objects, from watches to cars, to fridges, begin to send and receive data via the Internet.

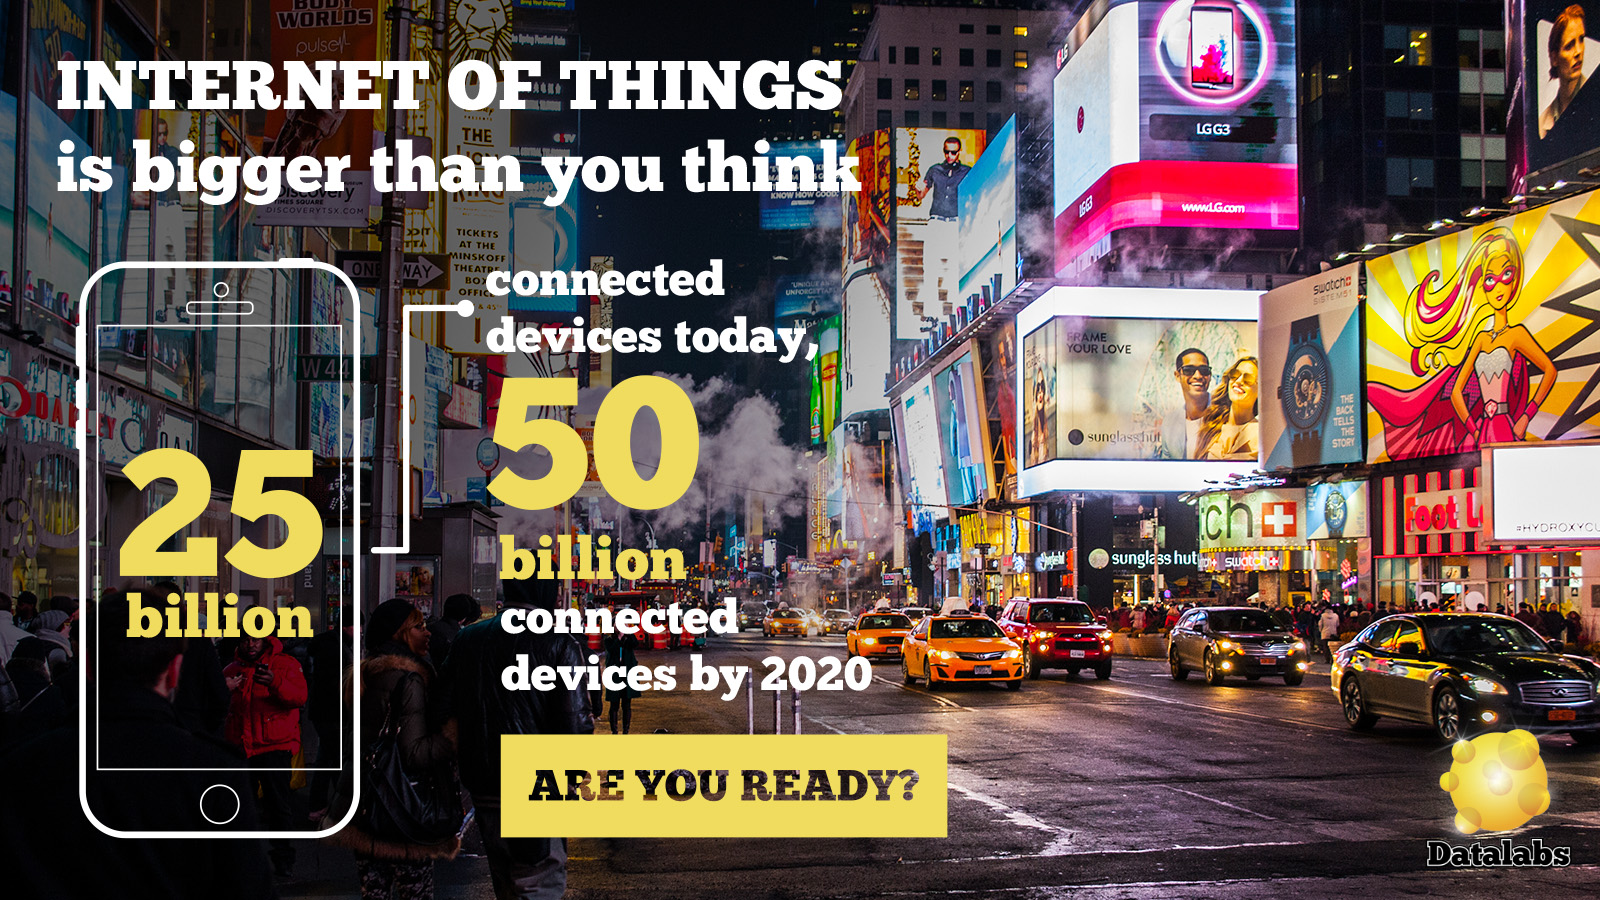
The growth trajectory of the internet of things is truly staggering: the number of connected devices surpassed the number of people on the planet in 2008; will top 25 billion worldwide in 2015; and, experts estimate, will climb to 50 billion by the end of the decade.

If you’re just starting to get your head around what the internet of things growth phenomenon means for you, we’d recommend this article on First Post, which argues that 2015 is the year that the era of the ‘internet of everything’ really begins.

0 Comments
  • data visualization
  • futurism
  • internet of things
0 Like!
Share
Datalabs

Data Visualization Training: Workshops & Courses

Shop Online for Data Visualization

  • Image of a man using our Power BI templates to design a report
    Power BI Templates
    Select options
  • Image of our custom Power BI Theme on a computer
    Power BI Theme and Style Guide
    Select options
  • An Introduction to Data Visualization and Storytelling Course
    An Introduction to Data Visualization and Storytelling Course
    Add to cart
  • Photo of a data visualization consultant advising clients and helping solve design issues.
    Data Visualization Consultant
    Buy product
  • Designing Great Dashboards Course
    Designing Great Dashboards Course
    Add to cart

Style Guides for Data?

A photo of our data viz style guide for Microsoft Power BI

Data Visualization & Storytelling Group Workshops

Contact Us

  • This field is for validation purposes and should be left unchanged.

From Our Blog

  • 8 Incredible Examples of Interactive Data Visualization
  • Data Analytics Conferences 2024 & 2025
  • Data Visualization & Design Conferences 2024 & 2025
  • Case-study: Intranet Dashboard Design for Nestlé
  • Dashboard Tips: 3 Alternatives To Using A Data Table
  • Data Visualization Training
  • Brand Guidelines for Data
  • Online Courses & Products
© 2024 Data Arts Pty Ltd
logo

We noticed you're visiting from United Kingdom (UK). We've updated our prices to Pound sterling for your shopping convenience. Use United States (US) dollar instead. Dismiss