The Data Analytics Conferences Guide 2024/2025 is your one-stop shop for conferences you actually want to go to. These are great conferences in cool cities.

Data Visualization and the Big Three Strategy Consulting and Big Four Accounting Firms How does a creative data visualization and visual analytics agency get along with the ‘suits’? Combing through

4 Reasons Your Business Should Be Using a Dashboard in Google Analytics & Why. Google Analytics is the go-to tool for most business web traffic collection. It’s lightweight, robust, easy

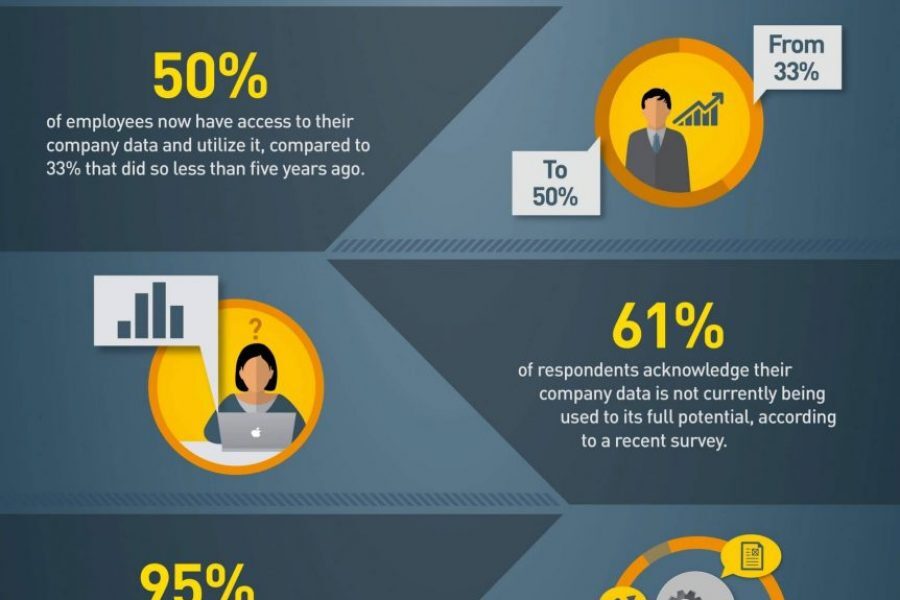
Big Data Infographic Report A recent report by SAP finds that the so-called power of Big Data has yet to be unlocked by decision makers. Datalabs has designed an infographic

Salespeople and their managers are extremely time-poor and extremely focused on their job: selling. They don’t have a lot of time to read through endless sales reports or to click

There's plenty of software to muck around with data, but to gain the skills to really get something out of it, that takes time and experience. Mikio Braun, a post doc in machine learning, explains . For a number of reasons, I don’t think that you cannot "toolify" data analysis that easily


