Visual Storytelling for Government

A Workshop Designed for Government Employees

Visual Storytelling for Government teaches public sector employees the skills to design infographics and PowerPoint.

Fun, interactive, and hands-on — this workshop will inspire your team to push for a new standard of government communications.

Here are eight things we like to cover:

Design for Your Audience

Define the important insights for your audience: an Executive, a Minister, or even the general public.

Less is More in Government Infographics

Learn the techniques to reduce information while highlighting what shouldn’t be missed.

Talk in Plain Language & Visuals

Speak in everyday language & visualize using simple charts, diagrams, & icons.

Diagramming for Government

Speaking of government diagrams, why not learn the proper method for creating a diagram?

Formats for a Modern Communications

Let’s look at dashboards, infographics, presentations, and interactive tools.

Be Inspired by Other Governments

The Datalabs Agency loves to show what other government agencies have done around the world.

Tell Stories in Templates

Learn how to scale your team’s storytelling with templates and structured stories.

Communicating Upwards

Don’t be scared of visualizing data for the top people in your organization. Rely on the best practices.

Professional Training in Public Service Data Visualization & Storytelling

Learn how to convert those hefty government reports and data sets into compelling data visualizations. Datalabs has over twelve years of experience working with all levels of government: local, state, and federal. This experience, in both Australia and the U.S., will be referenced in this workshop. Time and time again, we’ve seen dense reports, confusing diagrams, and lengthy datasets visualized in tables. This is why designed this workshop.

WORKING IN GOVERNMENT
IS HARD AS IT IS.
SEE HOW TO MAKE IT EASIER.

Simplify your job by simplifying your message — visually!

Tell Me More About the Visual Storytelling for Government Workshop

This workshop provides you with all the tools and techniques you can use to lift out a data visualization story without losing any important information. Leave with a process you can immediately apply to any report or dataset that ensures your hard work is presented in the best way possible. Throughout the training, your confidence in design will build through guided exercises, putting the theory to practice in both data viz and storytelling.

How long is the Visual Storytelling Workshop?

Four hours in total. We offer it in two two-hour sessions or as a continuous four-hour session.

Is there a limit to the number attendees per workshop?

No. But for online or virtual training. we find between 5 and 30 attendees per workshop is optimal.

Does the Datalabs Agency Use Microsoft Teams or Zoom?

Yes, we use Teams and Zoom for delivering our Infographics Workshops.. On-site workshops are possible, too. Ask about them in the form below.

How much would this Visual Storytelling Workshop cost?

We can price our workshops by the number of attendees or on a per workshop basis, whichever is least costly for you. Just ask us for an estimate.

Up-skill your team in the creative, visual communications for the public sector. A full-day workshop that can be customized for your department or agency.

Experience in Government Training: Data Design & Storytelling

Facilitators

Our facilitators have over 15 years of experience in data visualization, visual communications, and graphic design. Yet, we still love learning and further teaching our findings to others.

Any Location

Our data visualization agency is global. We understand that it is sometimes difficult to come to us with a busy workload. Our team will happily travel to your organization. Or choose remote facilitation by Zoom or Teams. We’re easy.

Track Record

Each workshop the team has conducted we believe to be successful, and we’ve done a lot. We take the sessions very seriously and are pleased to know they continue to resonate with attendees.

Visual Storytelling for Government Workshop

Now for All Levels of Government Staff — Learn to Design Infographics

The Datalabs Agency Trains Government Departments & Agencies

Over 50 training workshops facilitated in Australia, the U.S., the Middle East, and Europe.

  • Department of Finance
  • Department of Defence
  • Department of Education, Skills, and Employment
  • Productivity Commission
  • Reserve Bank of Australia
  • Department of Infrastructure, Regional Development, and Cities
  • Department of Treasury and Finance
  • Department of Justice
  • Bureau of Health Information
  • Department of Health and Human Services
  • Attorney General’s Department
  • Department of Education and Training
  • National Library of Australia
  • Australian Academy of Sciences
  • …and more…

More visuals, Less Text. Clearer Message.

Visual Storytelling for Government Employees: A Unique Training Workshop

In today’s digital age, effective visual communication is crucial for government agencies to connect with their citizens. Visual storytelling and data visualization offer powerful tools to convey complex information in a compelling and accessible manner. Why shouldn’t government employees embrace these techniques to enhance transparency, engagement, and decision-making?

Visual storytelling is best at combining narratives with captivating visuals.

For government employees, incorporating new techniques in design will enhance their ability to communicate key messages effectively. By leveraging images, videos, infographics, and interactive content, they can present data-driven narratives that resonate with the public. Visual storytelling not only simplifies complex information but also humanizes government initiatives, making them more relatable and engaging for citizens.

Data visualization is an essential tool for promoting transparency within government agencies.

By presenting data in easily understandable visual formats, employees can foster trust and confidence in government initiatives. Clear and accessible data visualization empowers citizens to explore information, track progress, and make informed decisions. Government employees should strive to use interactive charts, maps, and dashboards (so-called new data viz) to present data in an engaging and user-friendly manner, ensuring transparency and fostering an environment of openness.

Storytelling with public policy data aids understanding and therefore, aids in the decision-making process.

Government employees can utilize these techniques to analyze and interpret complex data, identifying patterns and trends that inform policy development. Visualizing data allows decision-makers to grasp insights quickly and make informed choices based on evidence. By presenting data-driven narratives, government agencies can inspire confidence in their decision-making processes and demonstrate accountability to the public.

It’s that simple. And it’s our hope that this workshop will move the dial of creative visual communications with data.

A Workbook for All Government Training Workshops

Add to your team's workshop experience — our Data Visualization & Storytelling Workbook is available in digital and printed versions.

The workbook consists of classroom-style instruction, theory, examples, and hands-on exercises. Order it along with our Visual Storytelling for Government Workshop and you will have everything you need to design great public infographics and PowerPoints. This is not your typical book; it’s packed full of practical knowledge that can be applied

immediately to your own projects. It doesn’t matter if you’re new to infographics or data design or have been creating them for years – there is something here for every skill level. By the end of this book, you can start applying these techniques to your team’s next project, creating stunning visualizations on your own.
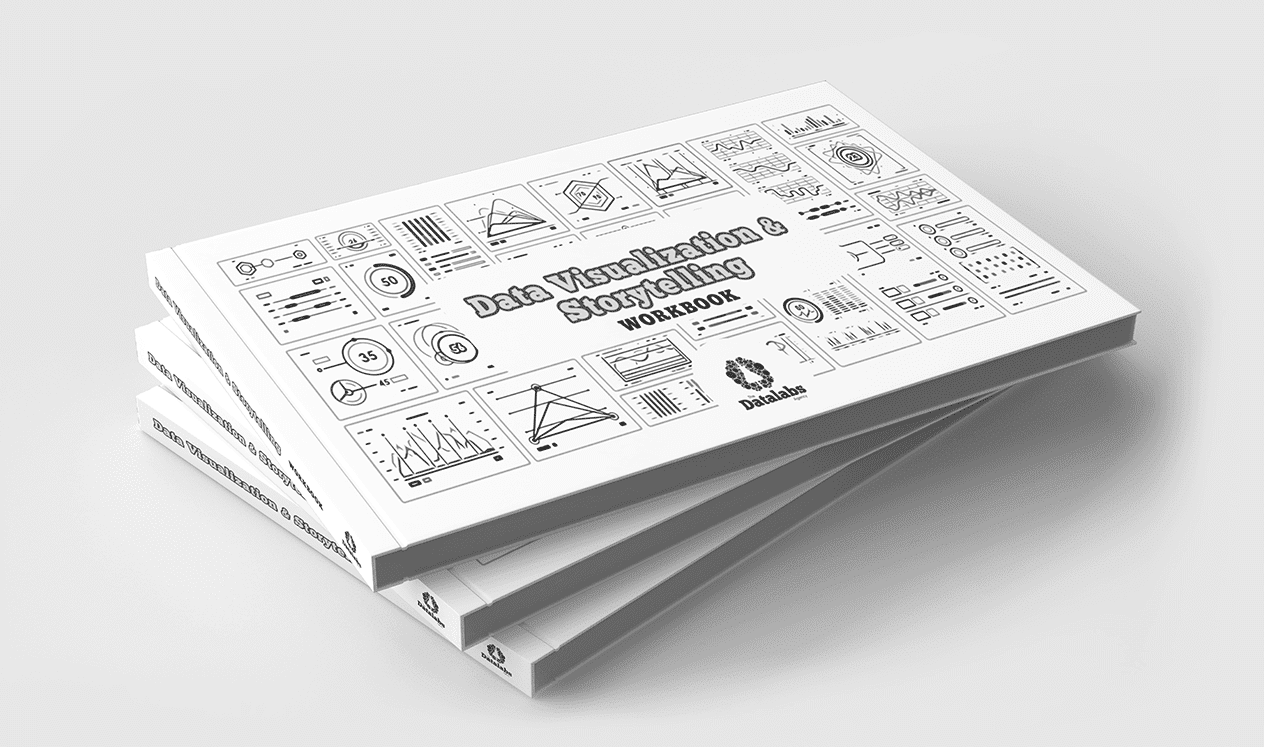
Image of three Microsoft Power BI workshops that accompany a Power BI training workshop

Interested to Know More About Our Government Workshops & Training Programs?

Get in touch below.

  • This field is for validation purposes and should be left unchanged.