The Department of Education and Training needed a clean and simple user interface to assist in the communications strategy for the Australian Government’s New Child Care Package. This interactive tool was a hit with parent's in need of some numbers.

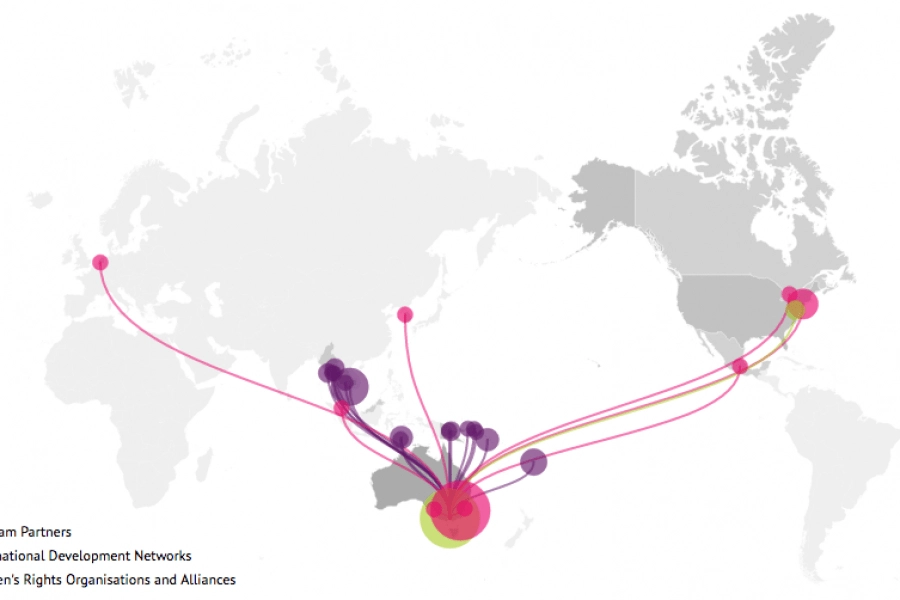
Looking for what data visualization can do for your website? Check out this live example of an interactive map developed for International Women's Development Agency.

To design for specific dashboard users and audiences, you need a process. The Datalabs Agency uses a 12-step process to design its dashboards. 12 sequential steps or tasks that

Our Data Visualization Conferences 2022 Guide is out! This is a comprehensive list of the best data viz conferences & summits from around the world. From January to December, there's a conference that's perfect for you.

How Do Professional Data Visualizers Design Business Intelligence Dashboards? Most professionals aren’t trained data visualizers. You might be a business analyst, data scientist, or an expert in another field who

The Data Arts Factory is Launching in 2022 The Datalabs Agency is excited to announce our new working space: the Data Arts Factory at Jack’s Magazine. Expanding our presence inside

2021 is the year of the accessible conference. More summits, forums, events can be accessed either completely or partially online. We're going virtual, baby! Now's the time to take advantage.

What do you think about the current methods of Covid-19 contact tracing? Where I live, it seems to be paper-based, paired with a non-functioning mobile app that gives me a

The Datalabs Agency has NEWS! Online Data Visualization and Storytelling Course Launch Hello, data friends! Click here for the “Introduction to Data Visualization & Storytelling Course”. We’ve been working hard

All chief executives have one thing in common – they need more TIME. There never seems to be enough hours in a day! Between meetings, conference calls, replying to emails

What is Explainable Artificial Intelligence (XAI)? A New Design Frontier in Machine Learning As smart algorithms, artificial intelligence and machine learning applications are finding its way into our daily lives,

Business Intelligence Tools Amazon Web Services recently came out with a shiny new toy for us data enthusiasts — Amazon Quicksight. For those of you (also us) that’s already used


