


Case Study of a Nonprofit’s Digital Animated Map
A real, live example of an interactive map developed for International Women’s Development Agency.
Click on the nodes to interact
Who:
International Women’s Development Agency (IWDA)
What:
A partnership and coalitions interactive map
How Long:
End-to-end, the project took five weeks
Why:
As part of IWDA’s digital annual report designed and developed by the Datalabs Agency, the International Women’s Development Agency (IDWA) asked us to lift the microsite interactivity by creating a live map. This map would demonstrate the reach and locations of IWDA partnerships and coalitions throughout the world.
How:
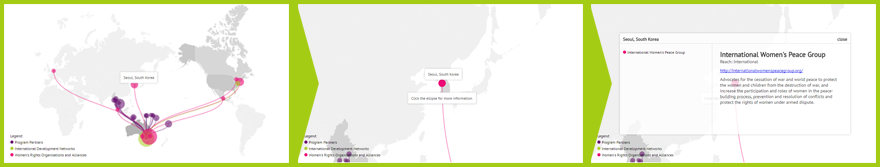
To present the full reach, a scroll-initiated animation was created to spread from the IWDA office and reach out to partners, women’s networks, and coalitions across the world. Once the animation ceased, the map would retain the overall reach view and reveal a legend of the different partnerships or organization types. These color-coded categories formed ellipses on the map that contained a short bio, name, and location of the organizations. As there were many addresses, and many existed in close proximity, we used larger cities as the initial focus. This allows the user to click through to the ellipses to delve deeper into the map data and return by clicking on the white of the map.
The result:
IWDA’s Digital Annual Report
An awesome map that combines animation and interactivity to engage the user, and contextualize the data. But don’t take our word for it, check it out yourself!
“We are very happy with the result, the map complements the microsite extremely well and explains the impact of IWDA’s programs, research, and partnerships from the community level, throughout the Asia Pacific region, and across the world.” – The IWDA Team
Want to literally map out your data?
Get in touch with us directly by emailing hello@datalabsagency.com
or by clicking the Contact Us link in the navigation.