hello@datalabsagency.com
logo
Datalabs Agency
En
  • De
  • Ar
0
logo
  • Data Training
    • Our Six Main Workshops
      • Introduction to Data Visualization: Tools & Techniques Workshop
      • Designing Great Business Dashboards Workshop
      • Infographics & Report Design Workshop
      • Creative Data Presentations with PowerPoint
      • Visual Storytelling for Government Workshop
      • Creative Power BI Dashboard Design
    • Online Courses
      • An Introduction to Data Visualization & Storytelling
      • Designing Great Dashboards
  • Data Design
    • Style Guides
      • Power BI Style Guides
      • Tableau Style Guides
    • Animated Data Videos
    • Maps & Cartography
    • Interactive Infographics
    • Power BI Dashboards Designs
    • Tableau Dashboards Designs
    • Infographic Reports
    • Interactive Data Visualizations
    • Digital Annual Reports & Microsites
  • Case Studies
  • Shop
    • Ecommerce Products
      • Power BI Templates
      • Power BI Theme and Style Guide
      • An Introduction to Data Visualization and Storytelling Course
      • Designing Great Dashboards Course
      • Data Visualization Consultant
  • Login
  • Contact
    • About
      • Otto Ottinger
      • Blog
Data Visualization Conferences 2015 0
Data Visualization Conferences 2015
14 December 2014
Content Marketing Analytics Strategy Infographic 0
Content Marketing Analytics: Getting Started, Adjusting Your Strategy
08 January 2015
Case Studies
Healthcare Marketing Dashboard
December 16, 2014 by Datalabs in Case Studies

With Datalabs’ help, at a Chief Marketing Officer’s level, reporting is now a unified dashboard — simple and insightful.

An online healthcare and insurance company came to Datalabs with a problem: zero visibility of its “big picture” marketing data. The company is the expert in digital marketing in its industry, but lacked a central dashboard, showing where it acquired its leads. The Datalabs Agency went to work.

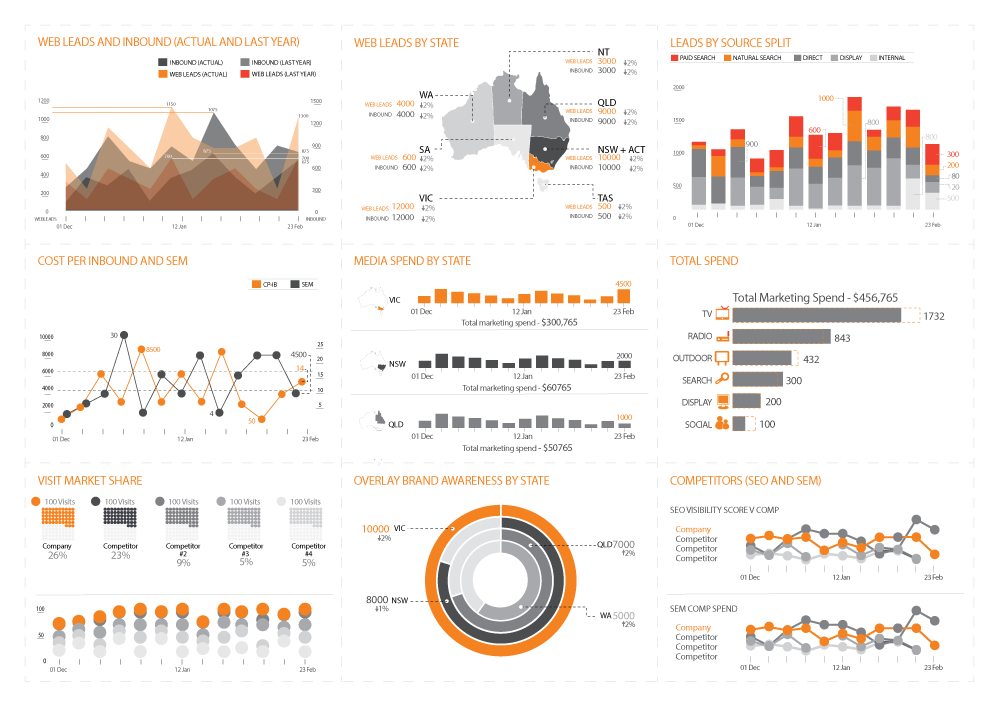
Datalabs aggregated and analyzed nearly 20 sources of data. We worked with the company’s various agencies and sifted through their marketing software feeds for insights that drove brand awareness, engagement, marketing costs, and leads. What was unique and what drove the business, we visualized in the dashboard below.

We visualized marketing channels, leads by geography, cost per lead, brand awareness, and we visualized where the company stood in relation to its competitors. For this healthcare and insurance company, reporting is no longer an endless series of PDF tables.

Healthcare Marketing Analytics Dashboard Design

Find out more about streamlining your marketing reports and systems with your own dashboard.

Interested in what we do?

Get in touch with us directly by emailing hello@datalabsagency.com
or by clicking the Contact Us link in the navigation.

0 Comments
  • Chief Marketing Officer
  • content marketing metrics
  • data dashboards
  • healthcare
  • marketing
  • marketing channels
  • Tableau
0 Like!
Share
Datalabs

Data Visualization Training: Workshops & Courses

Shop Online for Data Visualization

  • Image of a man using our Power BI templates to design a report
    Power BI Templates
    Select options
  • Image of our custom Power BI Theme on a computer
    Power BI Theme and Style Guide
    Select options
  • An Introduction to Data Visualization and Storytelling Course
    An Introduction to Data Visualization and Storytelling Course
    Add to cart
  • Photo of a data visualization consultant advising clients and helping solve design issues.
    Data Visualization Consultant
    Buy product
  • Designing Great Dashboards Course
    Designing Great Dashboards Course
    Add to cart

Style Guides for Data?

A photo of our data viz style guide for Microsoft Power BI

Data Visualization & Storytelling Group Workshops

Contact Us

  • This field is for validation purposes and should be left unchanged.

From Our Blog

  • 8 Incredible Examples of Interactive Data Visualization
  • Data Analytics Conferences 2024 & 2025
  • Data Visualization & Design Conferences 2024 & 2025
  • Case-study: Intranet Dashboard Design for Nestlé
  • Dashboard Tips: 3 Alternatives To Using A Data Table
  • Data Visualization Training
  • Brand Guidelines for Data
  • Online Courses & Products
© 2024 Data Arts Pty Ltd
logo

We noticed you're visiting from United Kingdom (UK). We've updated our prices to Pound sterling for your shopping convenience. Use United States (US) dollar instead. Dismiss