


2021 is the year of the accessible conference. More summits, forums, events can be accessed either completely or partially online. We're going virtual, baby! Now's the time to take advantage.
What do you think about the current methods of Covid-19 contact tracing? Where I live, it seems to be paper-based, paired with a non-functioning mobile app that gives me a
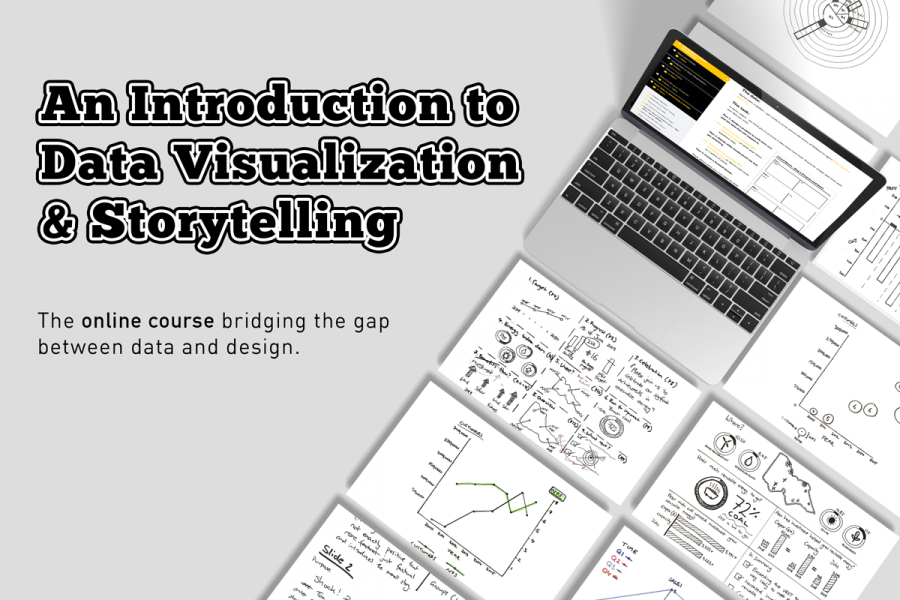
The Datalabs Agency has NEWS! Online Data Visualization and Storytelling Course Launch Hello, data friends! Click here for the “Introduction to Data Visualization & Storytelling Course”. We’ve been working hard

All chief executives have one thing in common – they need more TIME. There never seems to be enough hours in a day! Between meetings, conference calls, replying to emails

What is Explainable Artificial Intelligence (XAI)? A New Design Frontier in Machine Learning As smart algorithms, artificial intelligence and machine learning applications are finding its way into our daily lives,
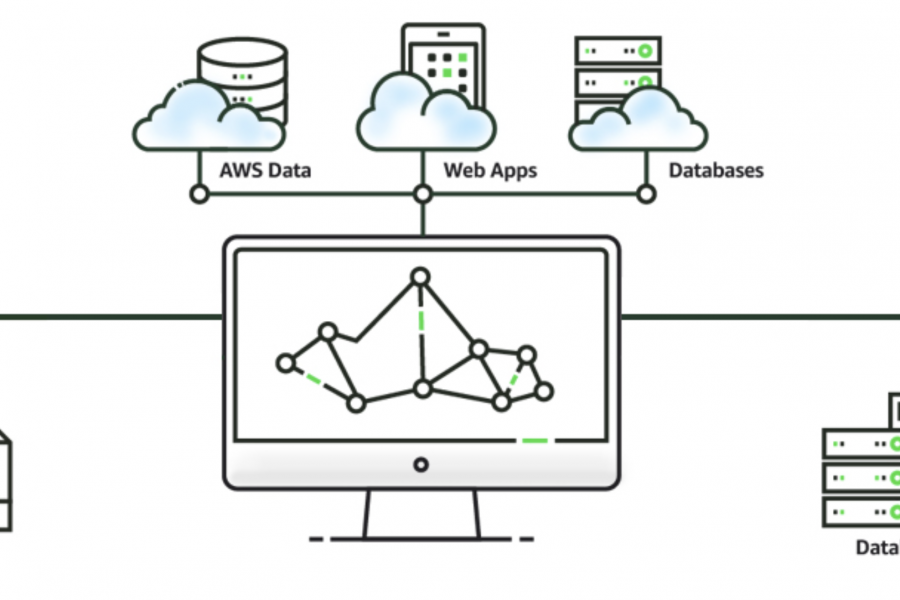
Business Intelligence Tools Amazon Web Services recently came out with a shiny new toy for us data enthusiasts — Amazon Quicksight. For those of you (also us) that’s already used
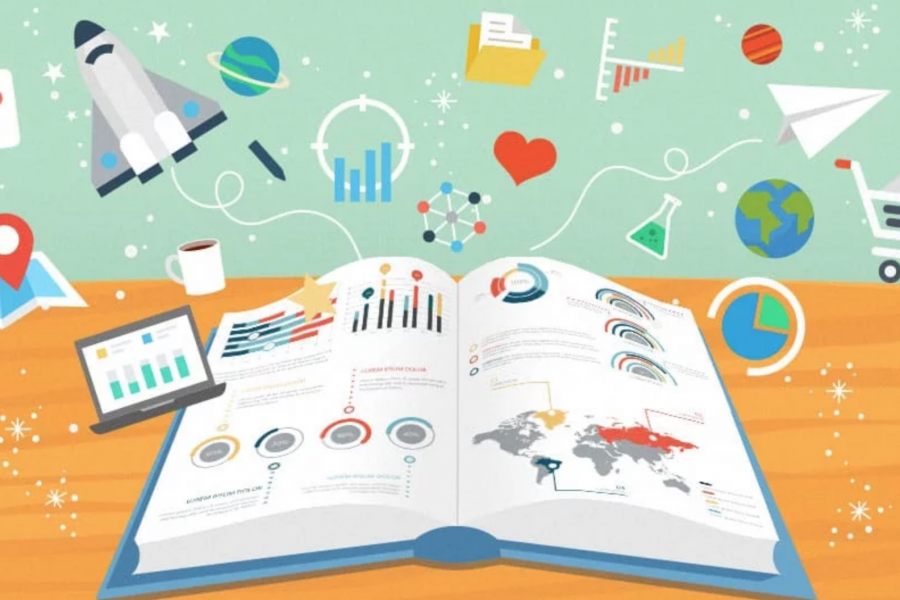
The Key to Data Storytelling: Creating Captivating Dashboards & Infographics “Those who tell stories rule society.” – Plato In the past, the role of a data scientist or analyst is simple
Design Thinking Meets Data Science The term “Big Data” has gained lots of attention in recent years. Want to know what the sexiest job of the 21st century is? It’s
The Future of Marketing Analytics The digital revolution today has brought disruption. Marketers have to think smart – and fast. Combined with the increasing and always-changing consumer expectations, decisions have
Data Visualization Brand Guidelines for Tableau, Microsoft Excel, Highcharts & Infographics As we have seen on projects time and time again, data scientists and data designers have two separate capabilities.
Animation & Motion Graphics are Great for Conveying Insights & Complex Ideas How can such complex, abstract, and intangible information be conveyed in an easy-to-understand and interesting manner? The answer:

Phew, can you believe it’s April already! Maybe they’re right when they say time runs faster as you get older. Even though the year has whizzed by, it’s never too