

The Future of Marketing Analytics
The digital revolution today has brought disruption. Marketers have to think smart – and fast. Combined with the increasing and always-changing consumer expectations, decisions have to be made accurately and quickly.
So What’s Changed in Marketing Analytics?
New technology such as the Internet of Things (IoT) has brought forth new media mix that marketers can leverage to communicate to consumers. This is a good thing, since there are significantly more touchpoints across a more diverse media landscape, giving marketers complete free range on which channels they choose for their marketing strategy.
Conversely, this has resulted in a power shift. The overabundance of engagement options, coupled with the 10,000 or so advertisements consumers view each day, has led to smarter and more alert audiences. Now marketers have to find out ways to better understand the expectations of their target audiences.
Let’s Take a Peek at What’s in Store for Marketers in the Near Future

1. Predictive Analytics – User Behaviour Predictions
Traditional marketing dashboards give insights into what has happened. In turn, predictive analytics uses machine learning algorithms to identify market trends before they emerge. This is called a recommender system.
How is it done? Consumer interaction data (e.g. in social media, in-store, or website) is analyzed using machine learning algorithms and the data is used to build consumer profiles. The system will then automatically calculate which strategies are best to implement for said profiles. Rich insights like these will help marketers channel their resources and plan campaigns in the right direction.
2. AI-driven Recommendations & Anomaly Detection
Aside from user-behavior, AI algorithms can suggest ROI-enhancing recommendations based on historical data. Marketing strategies can now be more succinct, increasing the chance of hitting the bullseye on the first try.
Anomalies in data patterns can also be detected quickly, allowing for fast corrective action.

3. One-stop Channel Management Platforms
With so many channels and so many tools used to manage multiple campaigns, using them all becomes unsustainable and a waste of time. Marketers need an integrated platform that is able to pull data from various sources into a single dashboard in a couple of flicks of a button – a one-stop tool if you will.

4. Natural Language Processing
Natural language processing (NLP) is defined as “algorithms that allow computers to process and understand human languages.” In terms of marketing analytics, this technology combines machine learning inference model, AI, and linguistics, to enable marketers to ask for specific data points as if they’re searching in Google.
These questions could go from very simple to very complex analytics – such as “how can I increase my ROI” or “predict consumer profile behavior in the next six months”. Instead of looking at a static dashboard over and over again, trying to decipher it yourself, why not let the software do it?
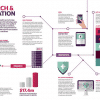
5. Voice-driven Dashboards
With the evolution of voice technology such as Google Home Assistant, Siri, or Alexa, verbal dashboard interaction is the future. Imagine talking to a dashboard as if you were interacting with a person – a “dashboard assistant” if you will.
No need to view graphs or charts on your devices, simply ask your assistant for data and recommendations on the go. How cool!
——
AI and machine learning are no longer buzzwords – they are the future! What do you think will be the next big thing in marketing analytics? Comment below!