


See Tableau dashboards examples in the wild. We've tracked down the best example of dashboard design done in Tableau. Get inspired.
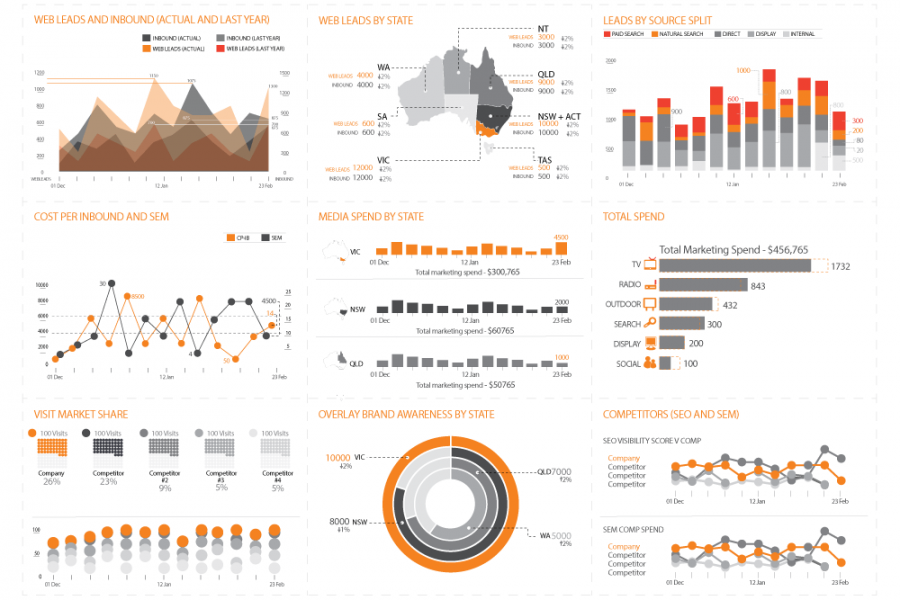
With Datalabs’ help, at a Chief Marketing Officer’s level, reporting is now a unified dashboard — simple and insightful. An online healthcare and insurance company came to Datalabs with a