


Tableau Launches Four New Exciting Features If you haven’t figured it out, we are OBSESSED with data visualization, dashboarding, and data discovery. One of our favorite BI tools, Tableau, recently

Five Common Mistakes People Make in Data Visualization The best way to learn is to make mistakes. That still rings true in terms of designing data visualization. Even the most

Our Opinion On Pie Charts …or the Case For and Against the Pie Chart. If there’s a list of controversial charts types in this world, then assume the pie chart
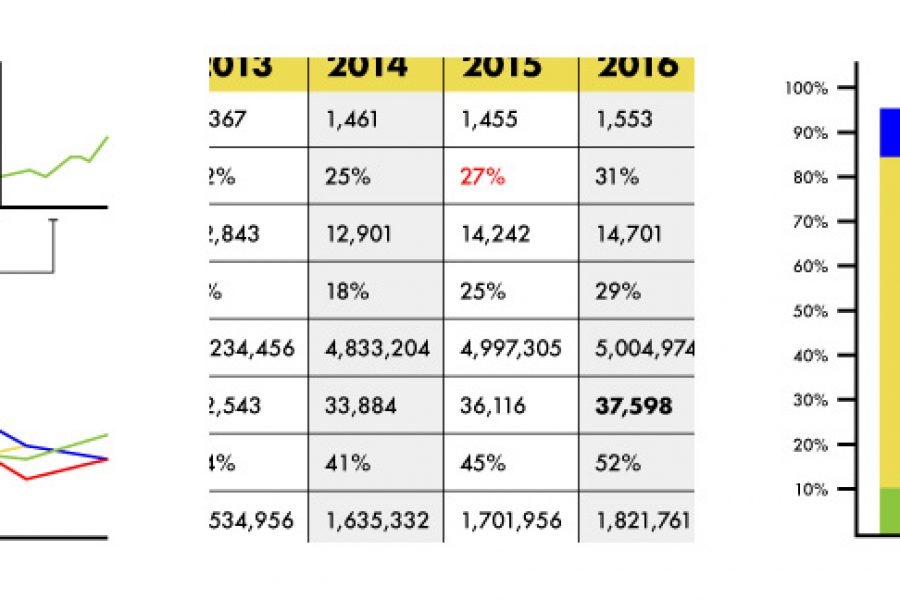
3 Alternatives To Using A Data Table Stop using tables. Seriously, there are better ways to show data. Here are three: When we run our data visualization workshops we run an
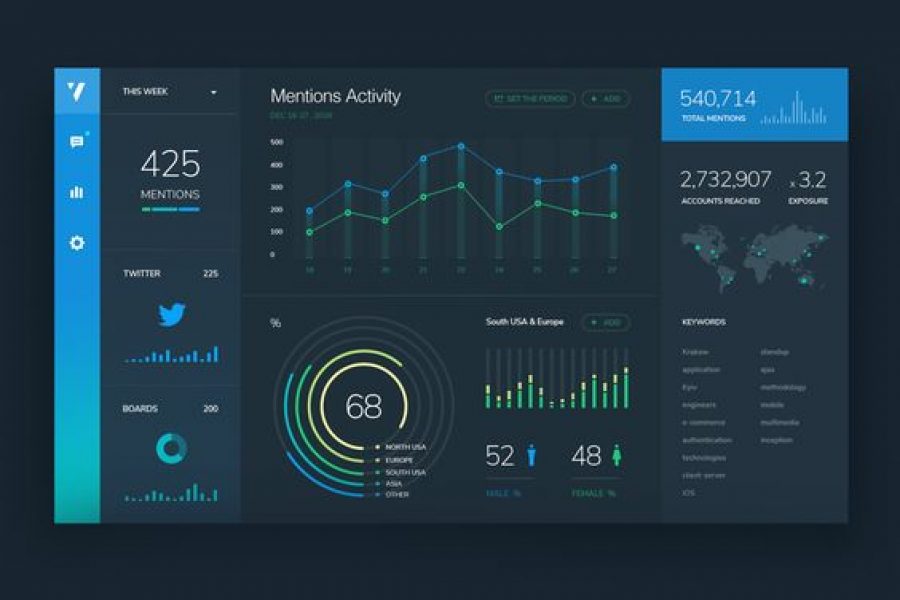
3 Pro Tips for Great Dashboard Design A strategic approach to visualizing your data through dashboard systems for humans. Here at Datalabs, we eagerly await the day computers gain sentience,

Six Reasons to Gift Skills Training to Your Employees The Benefits to Both Individuals and Businesses as a Whole At the Datalabs Agency, we’re firm believers in hiring great people

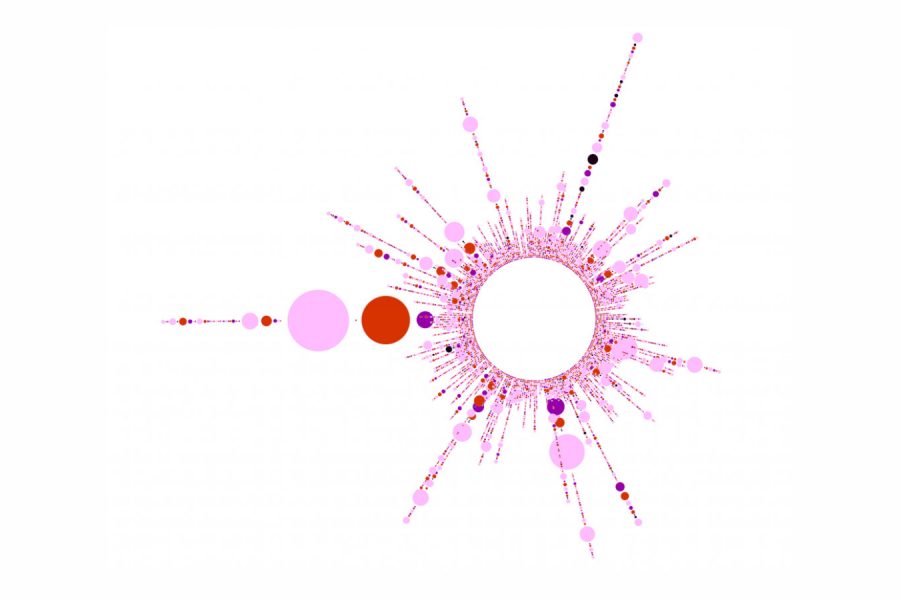
How to Tell a Story With Data Visualization Ideas and examples you can use in your organization to create a data-driven narrative The idea of collecting and storing massive amounts

5 Tips For Designing a Great Dashboard Not all dashboards are created equal – here’s how to get it right from the designers at the Datalabs Agency. Infographic dashboards are

Telling Stories With Data: From Simplification to Persuasion and Reporting. The Most Common Questions From Our Data Visualization Workshops. We can run our Data Visualization Workshops anywhere in the world,
8 More Common Types of Data Visualization Following up on our previous list of 15 Types of Data Visualization, which you can find here, we’ve come up with 8 more
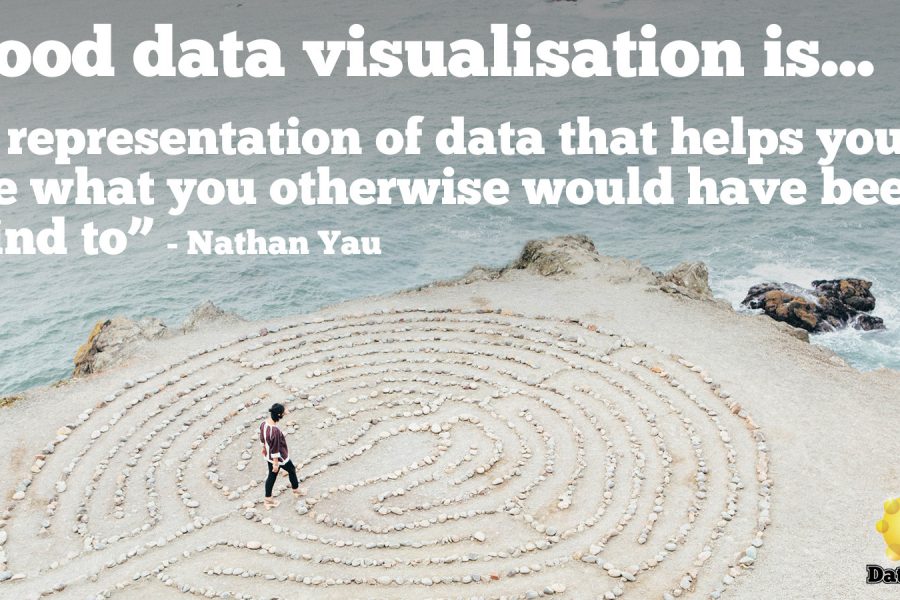
What Makes for Great Data Visualization and Why? Data visualization can be a powerful way to communicate. When done right, it delivers information with both the weight of respected research,

The Need For Data Visualisation Skills In Business A guide to skilling-up your employees An SAP-sponsored survey recently questioned business leaders about their opinions regarding the uptake and effectiveness