

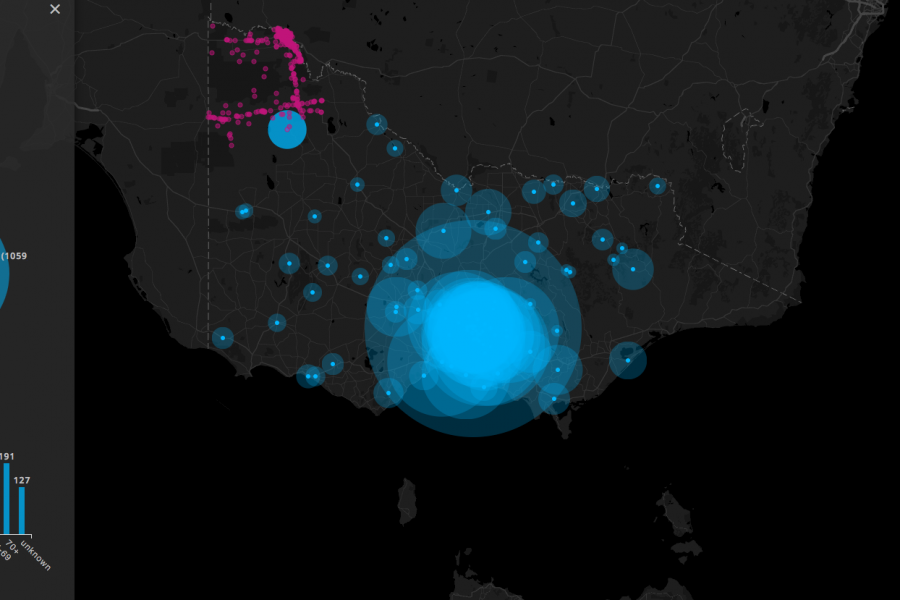
Three Interactive Data Maps Data-driven, Interactive & Animated If you’ve ever spoken to onto the DL team about a project there’s a fair chance we’ve tried to get a map

Data Visualization Websites — 101 of the Best Resources Ideas, inspiration blogs, people, tools, and more! We’ve searched and searched to bring you 101 data visualization websites that showcase the
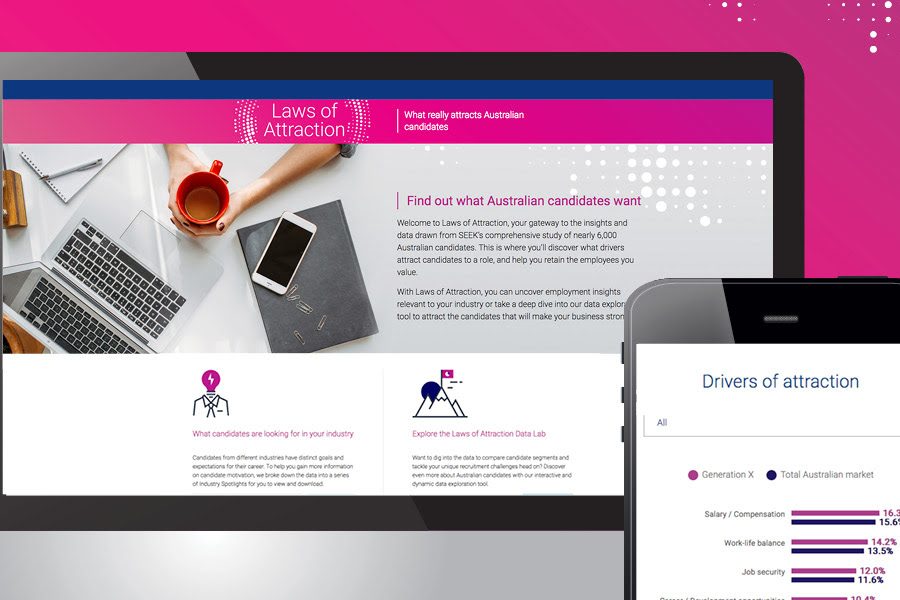
SEEK Laws of Attraction Find out what Australian candidates really want What attracts people to apply for a job or work for a company has changed. Where salary and job

Datalabs is looking for an energetic and motivated Content Marketing & Project Assistant to work on innovative content creation (infographics, animation, copy writing, and slide design) and client projects. Successful
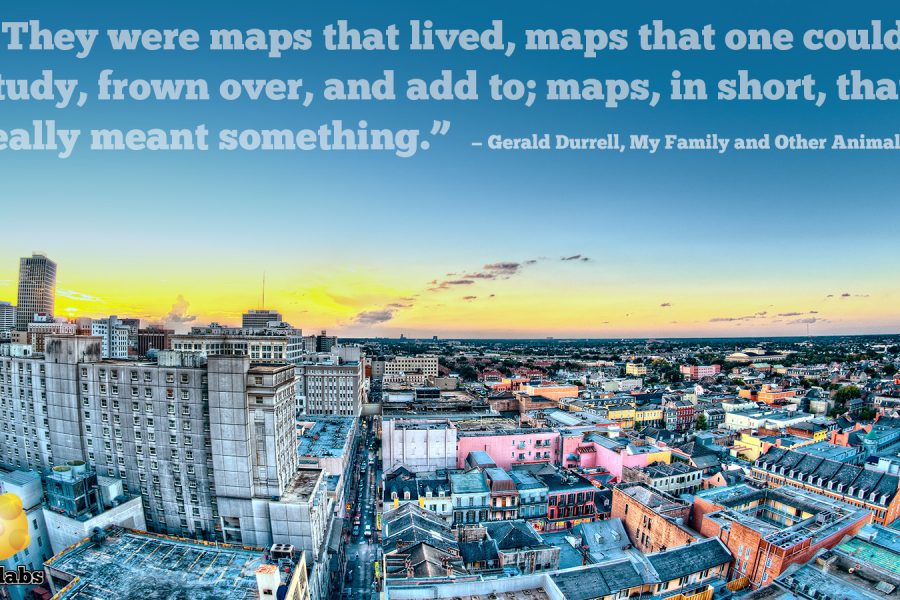
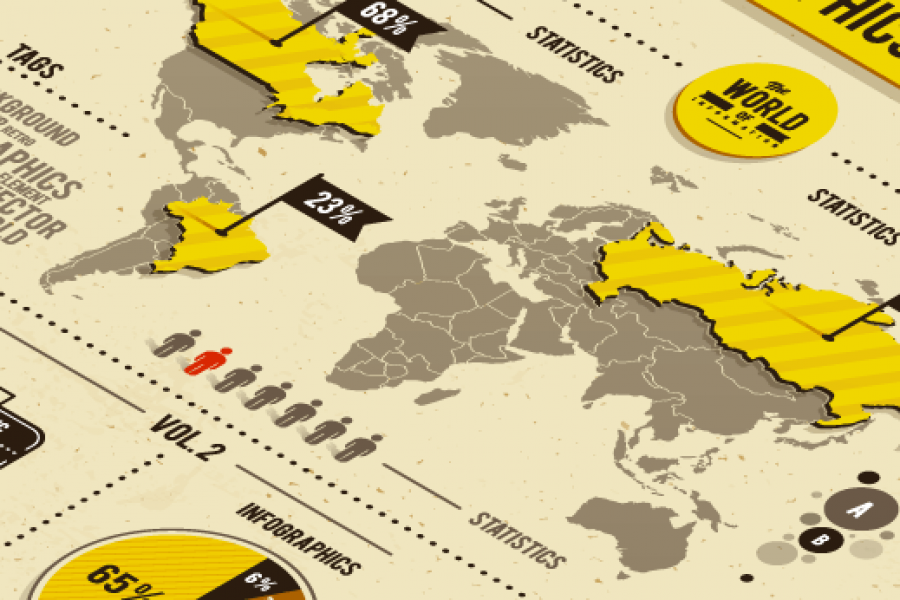
Data Stories & Map Design A look at how maps can help tell your data story Humans have used maps to share information about the world around us for over
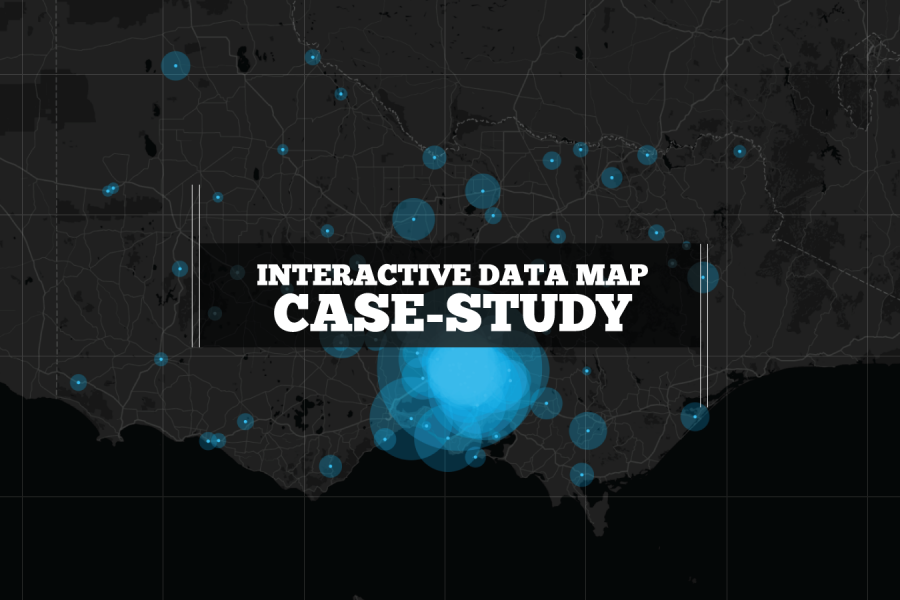
We built this interactive map as a use-case for interactive/explorable maps. It's UI and easy-of-use is a case study of how data visualization can make better sense of geographical data. Certainly better than a table in a spreadsheet!
Datalabs is looking for a driven Business Development Executive to support the Managing Director and the Associate Director in identifying new business opportunities, assisting in larger sales pitches, and driving

What Makes A Great Year in Review? A list of our most favorite digital annual report content elements for 2017 Almost everyone produces a Year-In-Review and most of those still
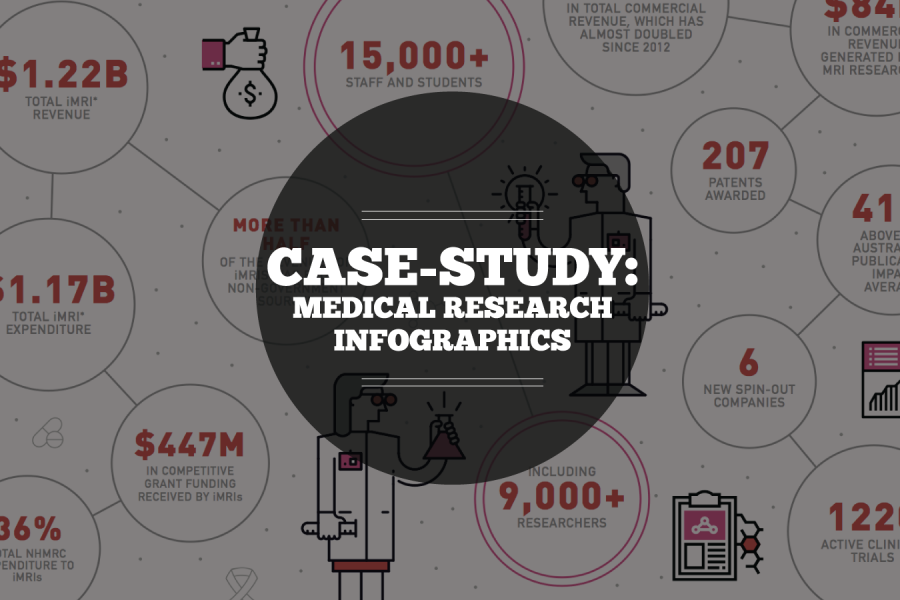
Case Study: Medical Research Infographic Who: Association of Australian Medical Research Institutes What: Summary Report Infographic When: August 2016 Why: The team at the Association of Australian Medical Research Institutes
Datalabs is looking for a Full Time Data Visualizer with experience in designing in Adobe Illustrator, as well as coding in JavaScript, CSS, and HTML. Presentation, public speaking skills also
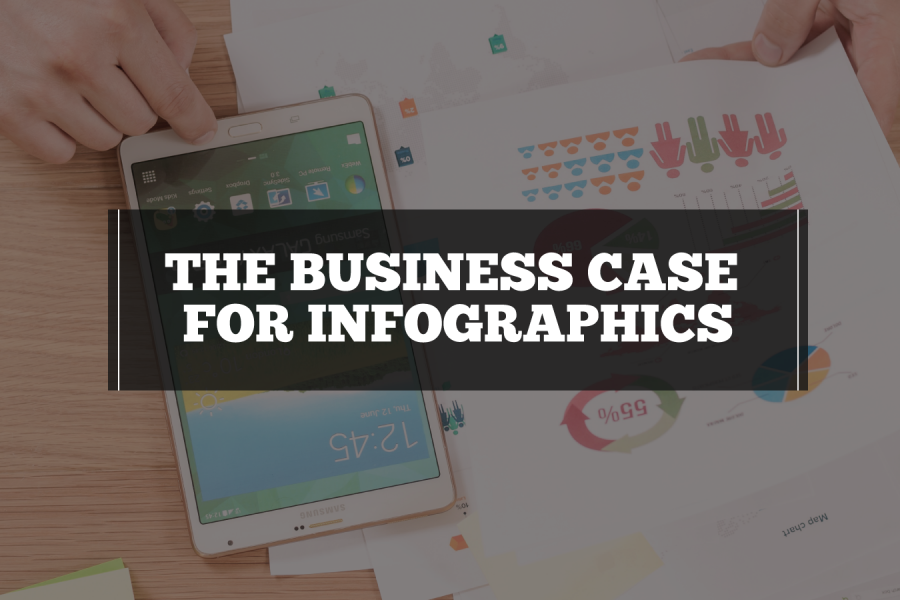
What Is The Business Case for Infographics? How You Prove The Value In Better Communication, Information Design & Reporting Your business has data and information. And your business needs to

Six Reasons to Gift Skills Training to Your Employees The Benefits to Both Individuals and Businesses as a Whole At the Datalabs Agency, we’re firm believers in hiring great people