


We’ve curated a list of gold-standard interactive data visualizations which we hope will inspire you to try it for yourself. May your data never be boring.
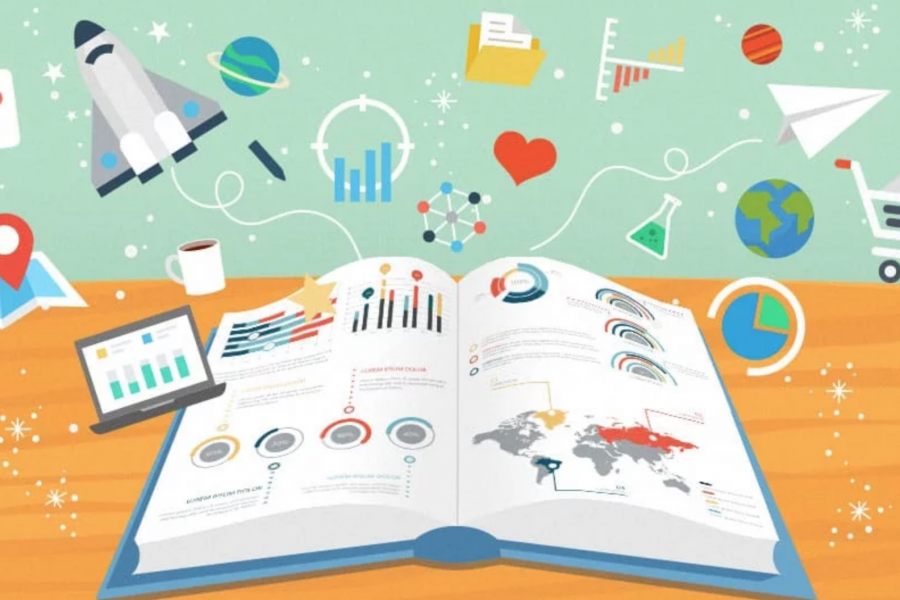
6 Captivating Information Visualization Examples Beyond Infographics, Charts & Graphs Thanks to the ubiquitous infographic, most people are well-acquainted with examples of information visualization. But infographics aside, we believe the
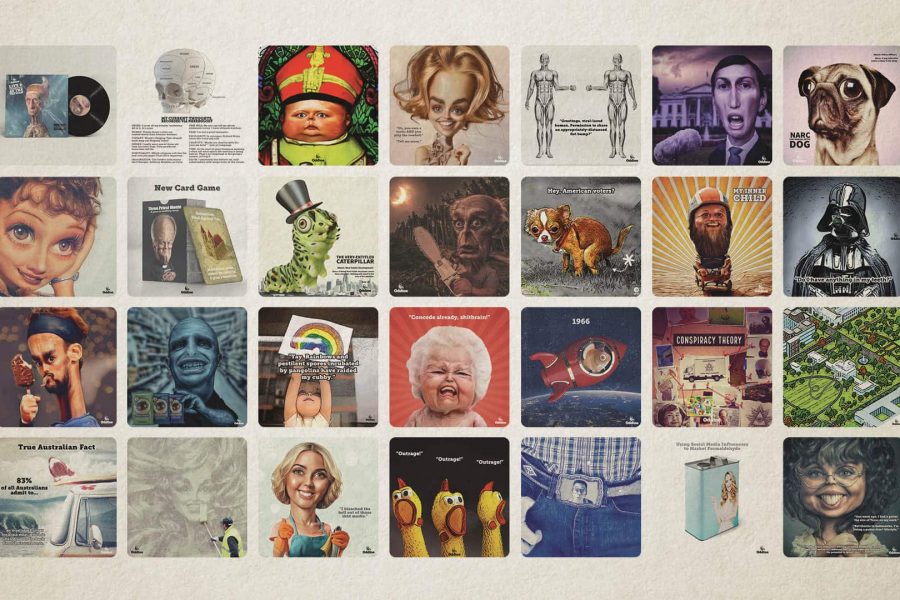
The Datalabs Agency is happy to announce the launch of its AI animation studio underneath the brand Oddtoe. As regular guests of the Datalabs website might recognize, Oddtoe provides much of the illustrated artwork and social media imagery for the agency.
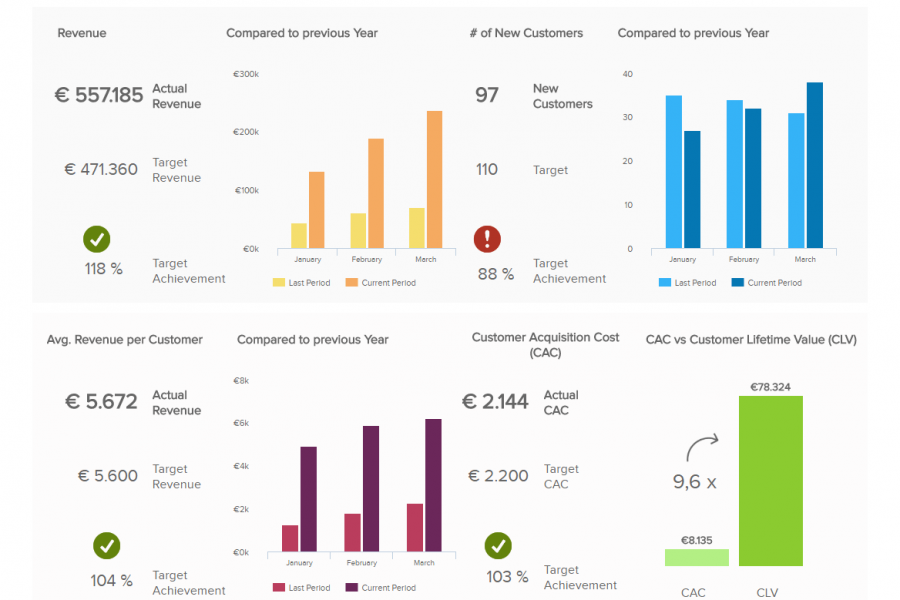
How Do Professional Data Visualizers Design Business Intelligence Dashboards? Most professionals aren’t trained data visualizers. You might be a business analyst, data scientist, or an expert in another field who
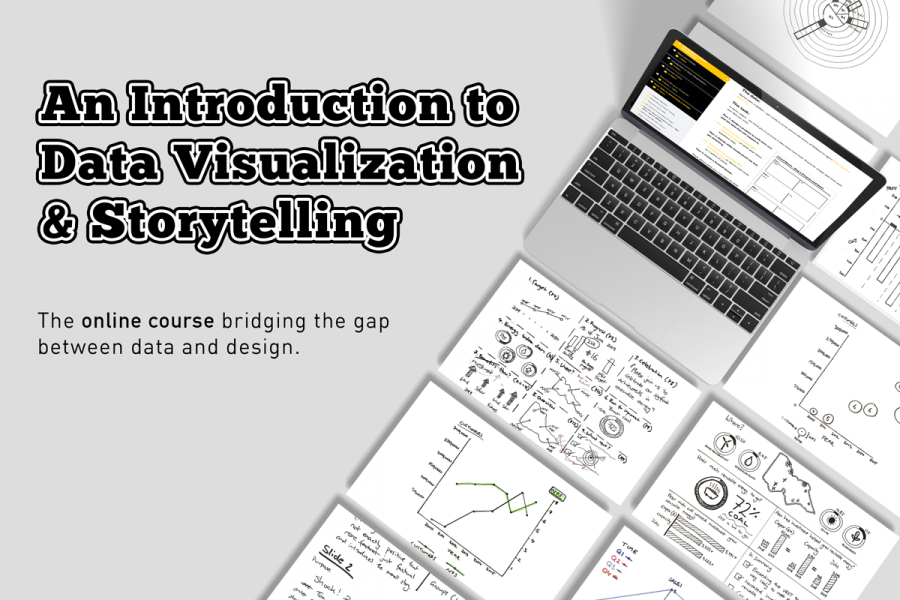
The Datalabs Agency has NEWS! Online Data Visualization and Storytelling Course Launch Hello, data friends! Click here for the “Introduction to Data Visualization & Storytelling Course”. We’ve been working hard
The Key to Data Storytelling: Creating Captivating Dashboards & Infographics “Those who tell stories rule society.” – Plato In the past, the role of a data scientist or analyst is simple
Animation & Motion Graphics are Great for Conveying Insights & Complex Ideas How can such complex, abstract, and intangible information be conveyed in an easy-to-understand and interesting manner? The answer:
Our Data Visualization Basics A Data Visualization Primer Let’s look at some data visualization basics. In today’s technologically advanced age, we are overwhelmed with data every day – not all

Ever wish you could hire just one person for all your topiary, robotics, sculpture, and projection art needs? Yea, we had the same wish. 🙂

Data Visualization Websites — 101 of the Best Resources Ideas, inspiration blogs, people, tools, and more! We’ve searched and searched to bring you 101 data visualization websites that showcase the
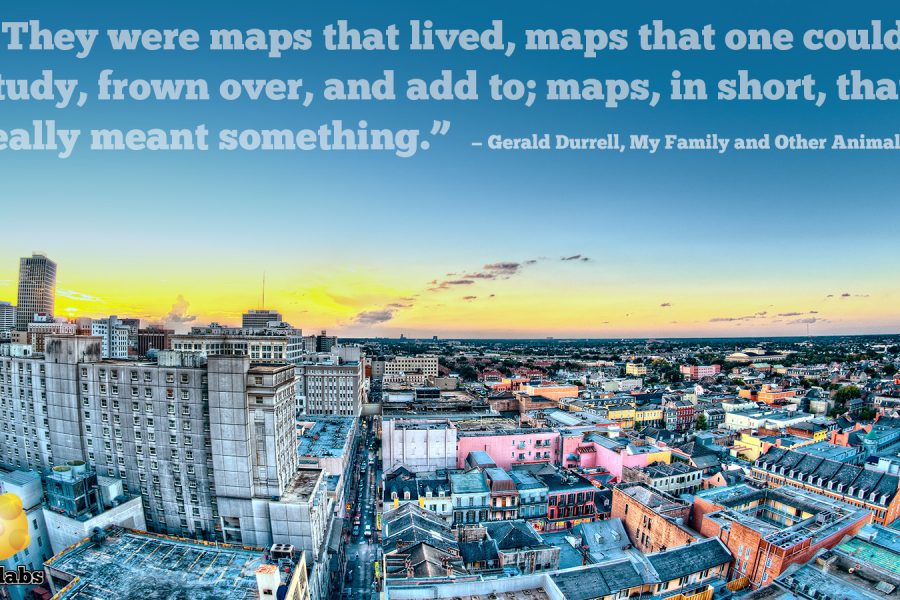
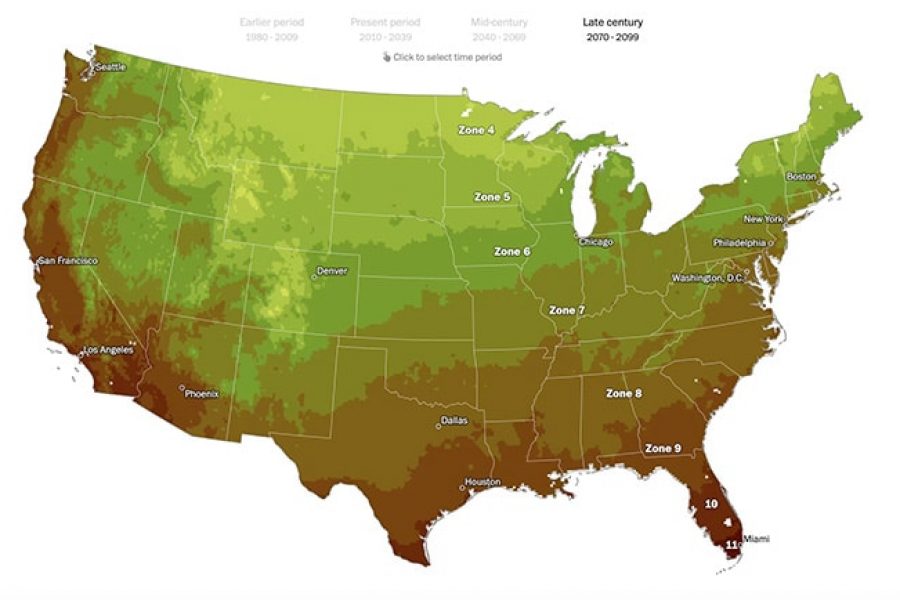
Data Stories & Map Design A look at how maps can help tell your data story Humans have used maps to share information about the world around us for over

What Makes A Great Year in Review? A list of our most favorite digital annual report content elements for 2017 Almost everyone produces a Year-In-Review and most of those still