


See 3 great tips for designing dashboards. Learn the strategic approach to visualizing your data through dashboard systems designed for humans.

What is Explainable Artificial Intelligence (XAI)? A New Design Frontier in Machine Learning As smart algorithms, artificial intelligence and machine learning applications are finding its way into our daily lives,
Business Intelligence Tools Amazon Web Services recently came out with a shiny new toy for us data enthusiasts — Amazon Quicksight. For those of you (also us) that’s already used

The Future of Marketing Analytics The digital revolution today has brought disruption. Marketers have to think smart – and fast. Combined with the increasing and always-changing consumer expectations, decisions have

Tableau Launches Four New Exciting Features If you haven’t figured it out, we are OBSESSED with data visualization, dashboarding, and data discovery. One of our favorite BI tools, Tableau, recently

Our List of Data Analytics Conferences for 2018 If you haven’t already seen it, our guide to your year of data viz conferences for 2018 is up now. And while there

Datalabs is looking for a Full Time Data Visualizer with experience in designing in Adobe Illustrator, as well as coding in JavaScript, CSS, and HTML. Presentation, public speaking skills also

Digital Marketing Dashboards & Systems Visualizations The Common Digital Marketing Problem No matter what industry, we’ve heard the same underlying problems in our clients’ marketing operations. Key questions that could

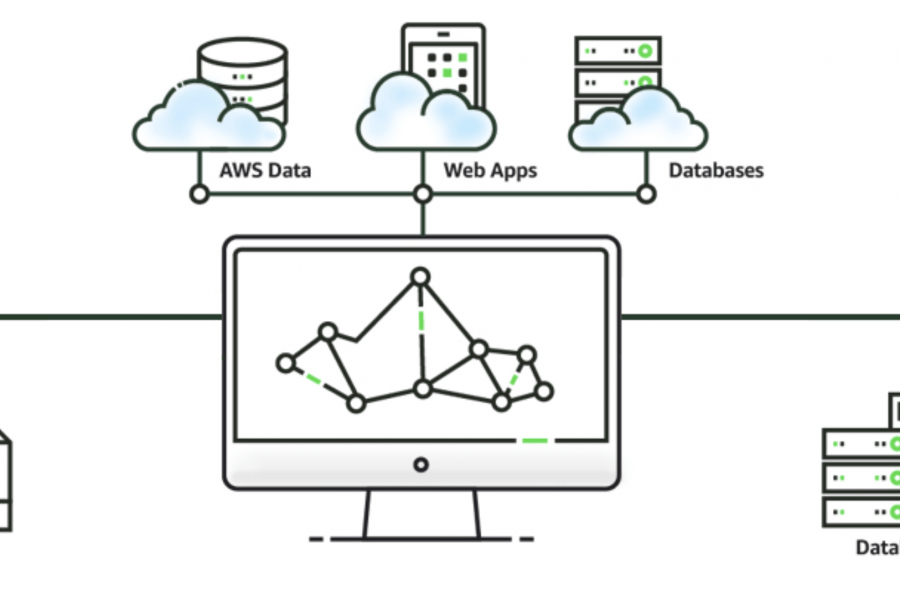
Do You Know What Your Digital Marketing System Looks Like? (Like, physically, looks like?) Imagine a Network of Veins, Valves, and Organs — all labeled for clarity, informing everyone who

Six Questions Content Marketers Should Ask of Their Google Analytics Data Understanding the Value and ROI of Content is Imperative to Modern Marketing Analytics. Here are some great ways to

6 of the Best Marketing Dashboards … And Why Your Business Needs One! Tired of tiny details and endless numbers on your marketing strategy report? Tired of constantly opening new tabs
“A Golden Age of Interface Design is coming. The creative and visual direction of data design can be inspiring and creative. Let’s make sure it is. Here’s a vision and