

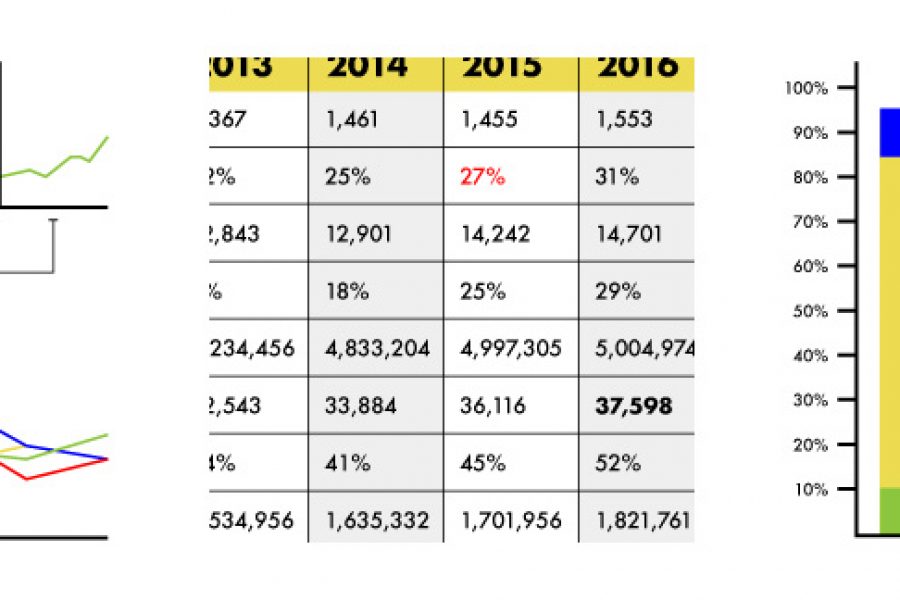
Stop using tables in your reporting. Seriously, there are better ways to visualize data. Here are three: »

See 3 great tips for designing dashboards. Learn the strategic approach to visualizing your data through dashboard systems designed for humans.

Six Reasons to Gift Skills Training to Your Employees The Benefits to Both Individuals and Businesses as a Whole At the Datalabs Agency, we’re firm believers in hiring great people

There are some tricks to making your data viz understandable and memorable, that is, by using repetition, alignment, and symmetry to your advantage.

The Use of Repetition, Alignment, & Symmetry in Data Visualization Design shows in clear examples how these design principles can be use in data viz and infographics. Learn something new.

To design for specific dashboard users and audiences, you need a process. The Datalabs Agency uses a 12-step process to design its dashboards. 12 sequential steps or tasks that

How Do Professional Data Visualizers Design Business Intelligence Dashboards? Most professionals aren’t trained data visualizers. You might be a business analyst, data scientist, or an expert in another field who

The Datalabs Agency has NEWS! Online Data Visualization and Storytelling Course Launch Hello, data friends! Click here for the “Introduction to Data Visualization & Storytelling Course”. We’ve been working hard

Design Thinking Meets Data Science The term “Big Data” has gained lots of attention in recent years. Want to know what the sexiest job of the 21st century is? It’s

Our Data Visualization Basics A Data Visualization Primer Let’s look at some data visualization basics. In today’s technologically advanced age, we are overwhelmed with data every day – not all

5 Benefits You Can Only Get From a Data Viz Workshop When it comes to getting the most out of your data, a face-to-face tutorial has advantages over your average

The Importance of Color in Data Design Let’s talk about color. How important are colors in data visualisation design? A science and art unto itself, colors play a major part