

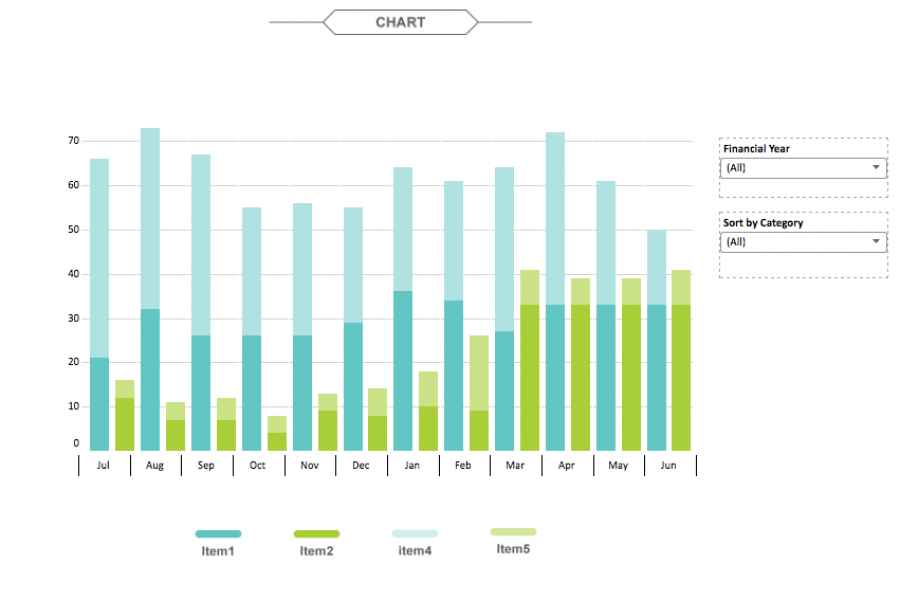
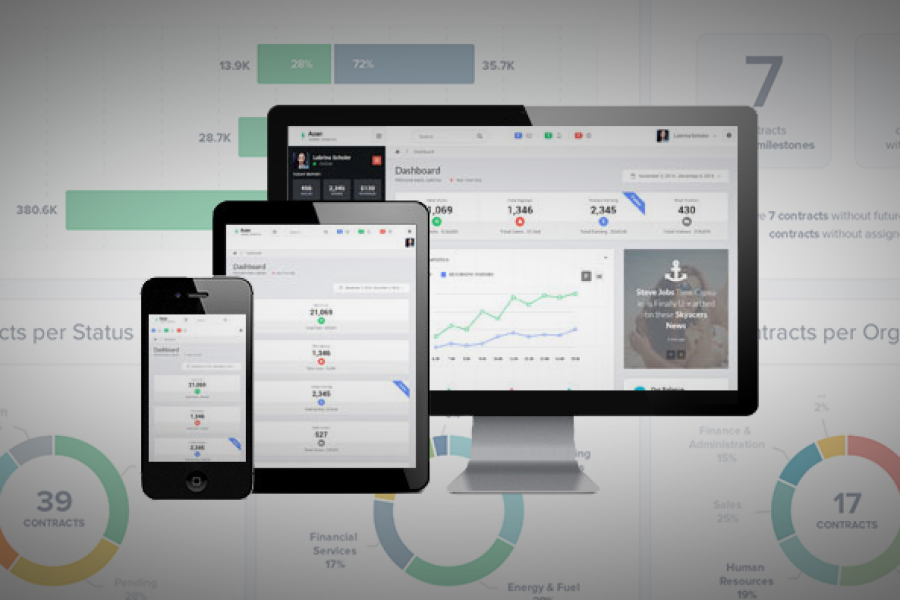
The aim for this project was to create an interactive dashboard, utilizing Tableau, to convey the data that had been collected over the financial year. Check out this financial firm's reporting suite.
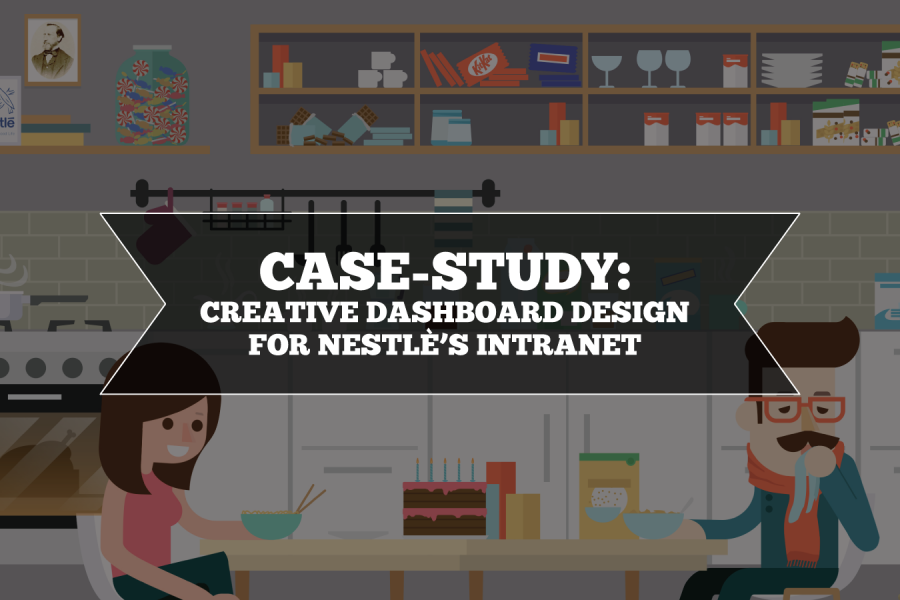
Nestlé's aim was to develop an easy-to-use, visually engaging experience that would help to make Nestlé employees’ jobs easier, and therefore, more enjoyable. The Datalabs Agency designed and developed a fun Intranet portal in response.
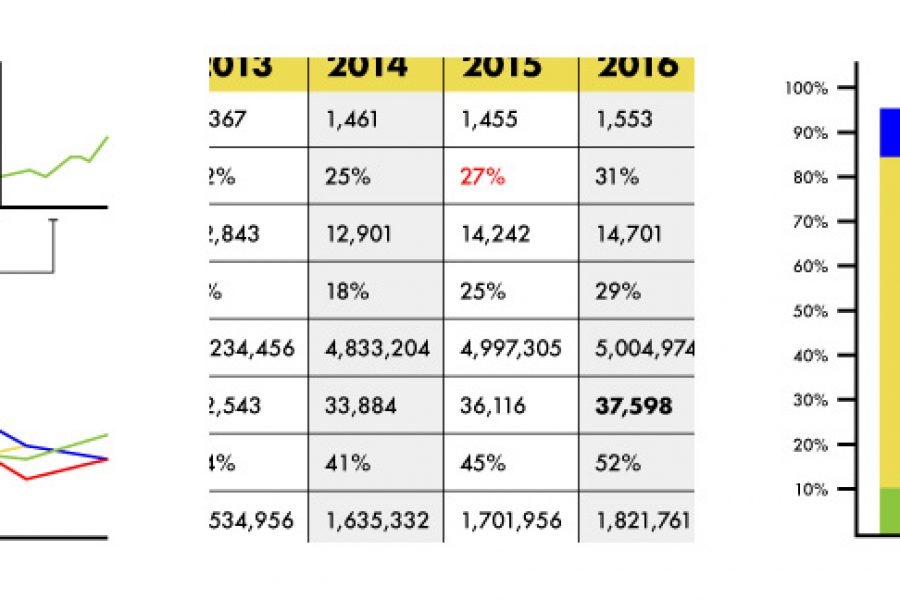
Stop using tables in your reporting. Seriously, there are better ways to visualize data. Here are three: »
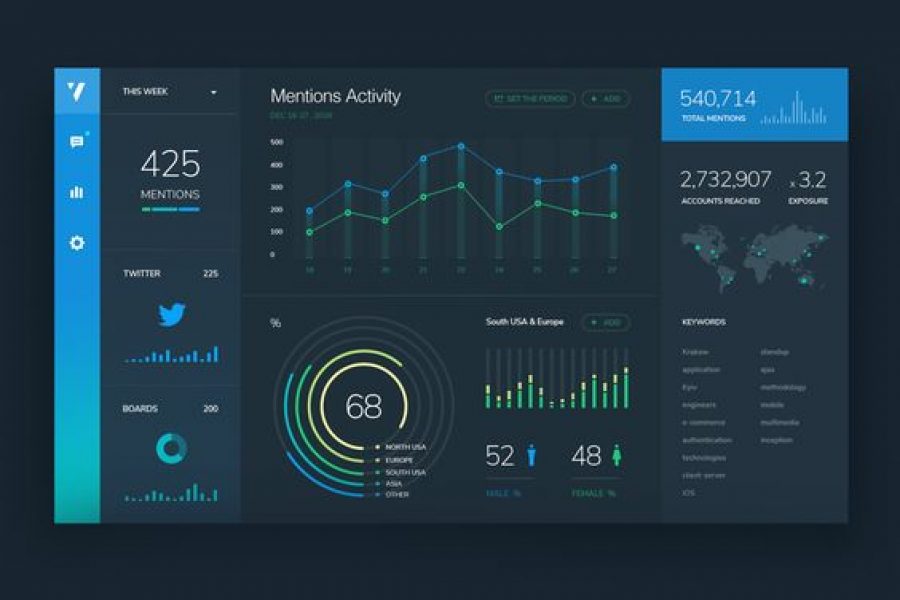
See 3 great tips for designing dashboards. Learn the strategic approach to visualizing your data through dashboard systems designed for humans.

Looking for a freelance infographic designer to hire? See our work here at Datalabs. About the Infographic Designer role: Our Infographic Designers are the agency’s creative visualisers and graphic designers,
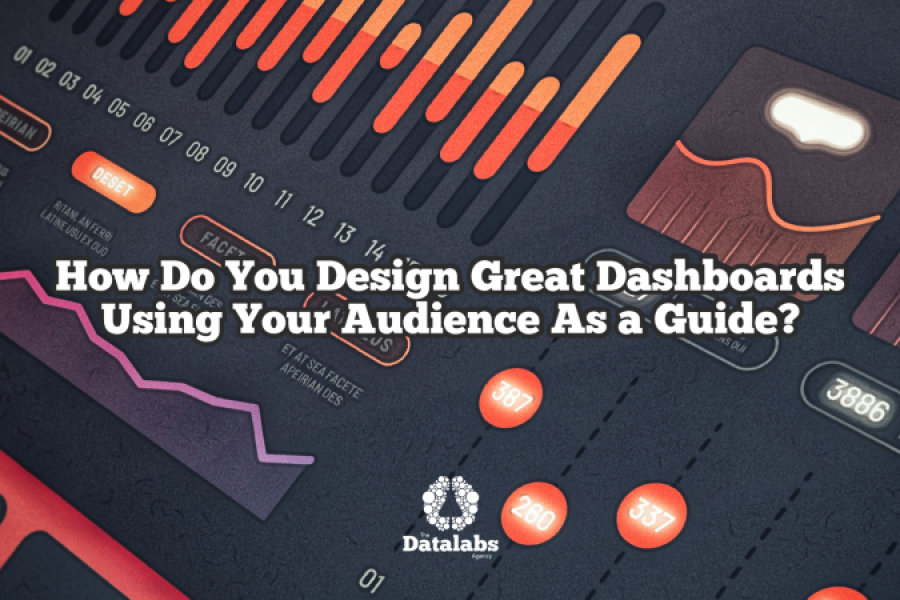
To design for specific dashboard users and audiences, you need a process. The Datalabs Agency uses a 12-step process to design its dashboards. 12 sequential steps or tasks that

How Do Professional Data Visualizers Design Business Intelligence Dashboards? Most professionals aren’t trained data visualizers. You might be a business analyst, data scientist, or an expert in another field who

The Key to Data Storytelling: Creating Captivating Dashboards & Infographics “Those who tell stories rule society.” – Plato In the past, the role of a data scientist or analyst is simple

Design Thinking Meets Data Science The term “Big Data” has gained lots of attention in recent years. Want to know what the sexiest job of the 21st century is? It’s
6 of the Best Marketing Dashboards … And Why Your Business Needs One! Tired of tiny details and endless numbers on your marketing strategy report? Tired of constantly opening new tabs
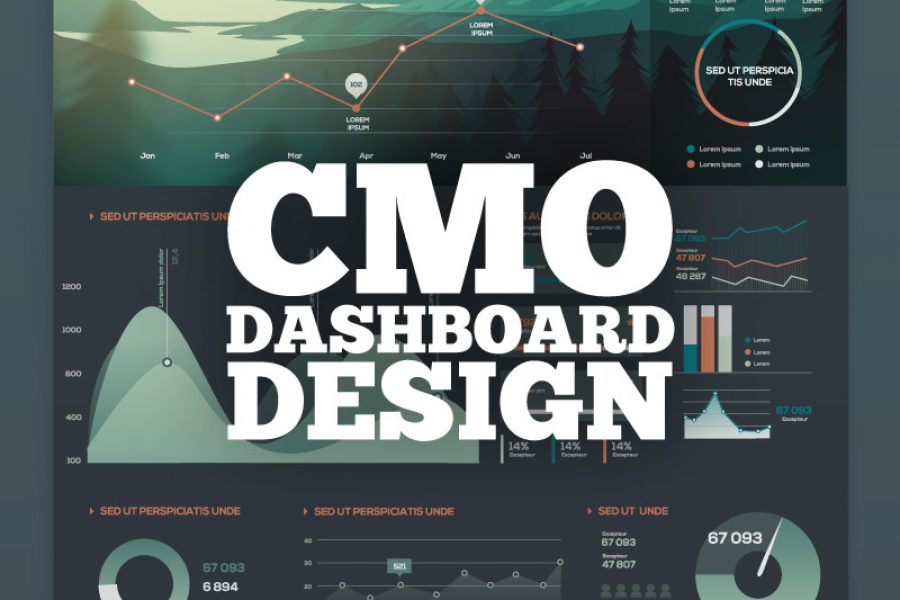
Recruiting a Chief Marketing Officer in a data-driven world isn’t easy. Heads of corporate marketing often rise through the ranks without the scientific or technological background needed today. This presentation

Telling Stories With Data: From Simplification to Persuasion and Reporting. The Most Common Questions From Our Data Visualization Workshops. We can run our Data Visualization Workshops anywhere in the world,