Three Interactive Maps

Three Interactive Data Maps Data-driven, Interactive & Animated If you’ve ever spoken to onto the DL team about a project there’s a fair chance we’ve tried to get a map

Share
SEEK Laws of Attraction

SEEK Laws of Attraction Find out what Australian candidates really want What attracts people to apply for a job or work for a company has changed. Where salary and job

Share
Content Marketing & Project Assistant

Datalabs is looking for an energetic and motivated Content Marketing & Project Assistant to work on innovative content creation (infographics, animation, copy writing, and slide design) and client projects. Successful

Share
Business Development Executive

Datalabs is looking for a driven Business Development Executive to support the Managing Director and the Associate Director in identifying new business opportunities, assisting in larger sales pitches, and driving

Share
Case Study: Medical Research Infographic

Case Study: Medical Research Infographic Who: Association of Australian Medical Research Institutes What: Summary Report Infographic When: August 2016 Why: The team at the Association of Australian Medical Research Institutes

Share
Data Visualizer & Coder

Datalabs is looking for a Full Time Data Visualizer with experience in designing in Adobe Illustrator, as well as coding in JavaScript, CSS, and HTML. Presentation, public speaking skills also

Share
Pillar Superannuation Tableau Dashboard Report

The aim for this project was to create an interactive dashboard, utilizing Tableau, to convey the data that had been collected over the financial year. Check out this financial firm's reporting suite.

Share
Infographic Report Design

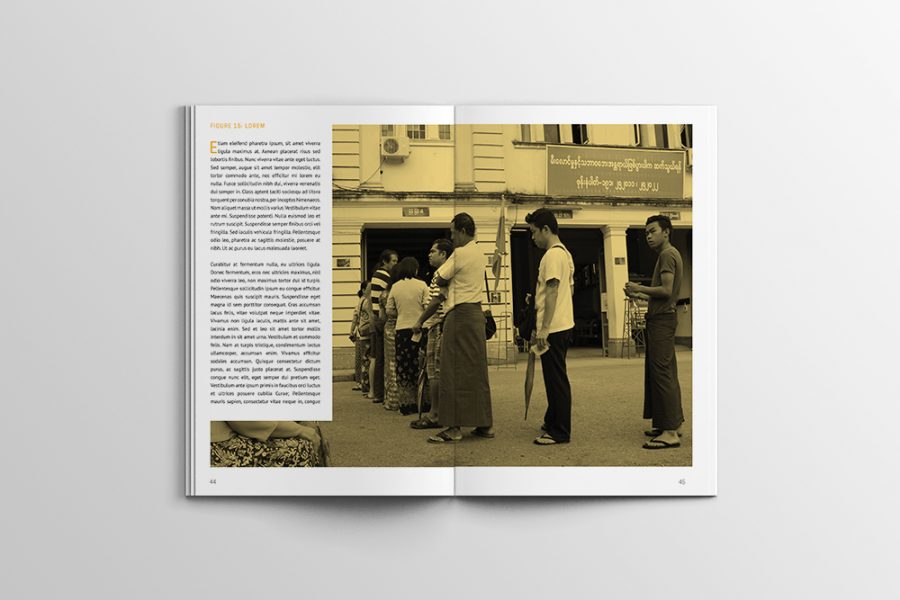
Case Study: A Long Infographic Report Design We recreated a long research report with an infographic style, using charts and graphs to convey the data they’d collected, over the period

Share
Infographic Case Study

A large Australian and New Zealand food manufacturer engaged Datalabs to visualize a set of survey results undertaken by their human resources department and an external consultancy. The result was this visually engaging infographic.

Share
2015 Federal Treasury Budget Animated Videos by Datalabs

Datalabs is proud to show our work with the Federal Department of the Treasury for the 2015 Budget. Datalabs was hired in April to animate three videos, visualising the overview

Share
Metadata & What Australia’s Data Retention Law Means For You

You might have heard a lot of noise about the proposed data retention scheme in Australia. The Australian Government wants phone and Internet companies to keep ‘metadata’ on their customers

Share
China Beef Animated Data Video for ANZ

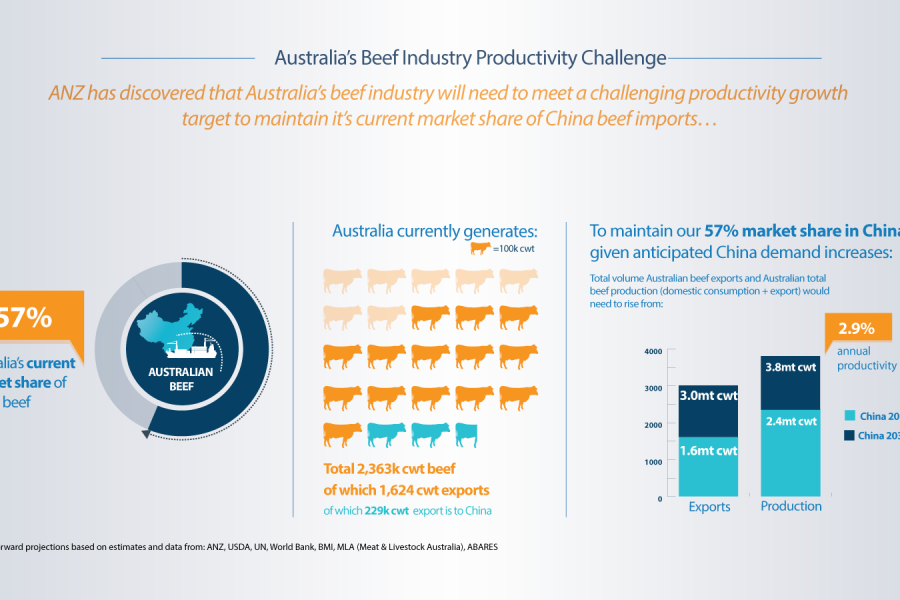
Recent work we completed for ANZ’s International & Institutional Banking division on China Beef. This animated data video leverages the data visualisation and infographic design work Datalabs’ team created and

Share