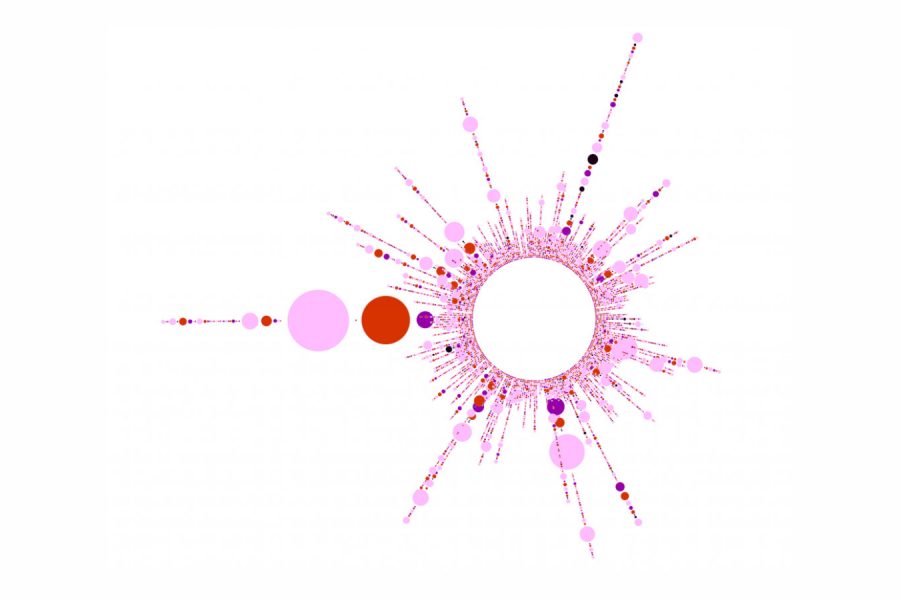
2017 Summed Up in 10 Revealing Data Viz and Infographics A list of some of our favorite visualizations that explain the year that was 2017. 2017 was an interesting year,

Datalabs is looking for a Full Time Data Visualizer with experience in designing in Adobe Illustrator, as well as coding in JavaScript, CSS, and HTML. Presentation, public speaking skills also

Our List of Data Analytics Conferences for 2017 In today’s Age of the Internet data is everywhere – and every day brings more data. In fact, the amount of data readily

With the dust now beginning to settle, let’s take a different look into the past US Election… Politics and outcomes aside, American elections bring with them an enormous responsibility to

6 Examples of NPS Charts: How to Best To Visualize a Net Promoter Score Love it, hate it (or neither…) – Net Promoter Score (NPS) is a key success measure

Our List of Data Visualization Conferences for 2017 With Christmas decorations now flooding department stores, we figured it was time to update our list of data visualization conferences and events

Recruiting a Chief Marketing Officer in a data-driven world isn’t easy. Heads of corporate marketing often rise through the ranks without the scientific or technological background needed today. This presentation
“A Golden Age of Interface Design is coming. The creative and visual direction of data design can be inspiring and creative. Let’s make sure it is. Here’s a vision and

No Chief Data, Chief Digital, or Chief Marketing Officer will be spared the deluge of data coming from the Internet of Things (IoT). I propose the challenge initially isn’t a

How to Tell a Story With Data Visualization Ideas and examples you can use in your organization to create a data-driven narrative The idea of collecting and storing massive amounts

Data Visualization and the Big Three Strategy Consulting and Big Four Accounting Firms How does a creative data visualization and visual analytics agency get along with the ‘suits’? Combing through