

Data Visualization Brand Guidelines for Tableau, Microsoft Excel, Highcharts & Infographics
As we have seen on projects time and time again, data scientists and data designers have two separate capabilities. This is why there are data visualization brand guidelines – to help data scientists, also data designers, create visualization products that communicate its data effectively. These style guides provide recommended approaches in making decisions so that your data narrative is clear and concise.
Captivating data viz needs good design. What is the use of amazing data if it’s not presented in an equally amazing way? The first step of a great product is to make it engaging, or else It won’t reach its full potential of audiences.
To present your data for different platforms, the most common tools we design style guides are Tableau, Power BI, Excel/PowerPoint, Highcharts for Web, and the Adobe Suite for infographics, Adobe Illustrator, and Indesign in particular. Each tool has its own capabilities, so ideally you’d collect them all!
Tableau & Power BI Brand Guidelines
Are our preferred tools for Business Intelligence (BI) dashboards. But Tableau & Power BI may take a while to get used to. They are very powerful, have an evergrowing amount of features but they can get quite complicated easily.
Before getting started, it’s great to consider your primary audience, how much time they have to consume the dashboard, and what questions they are seeking answers to. This will help you initially visualize how straightforward or comprehensive the end product dashboard will be, and what is necessary to include as well as exclude.
1. Templates & Layout
We recommend are a great building block for dashboard brand guidelines and always form part of our approach to dashboard design. From KPI and sales dashboards to infographic style, through to analytical data tools, a known and understood set of layouts and structures helps drive consistency, and therefore uptake.

For easy consumption, layout your elements in a Z formation – just like how one would read a book.
Other considerations: F formation (key points on the left side) and radial view (key message at the center)
Start with the important questions first, then gradually moving on to secondary information. Not all information has to fit in a dashboard, and that’s okay. A dashboard is not supposed to be a long-term exploratory tool, it’s meant to be a few seconds to couple minutes read before people move on to their next tasks.
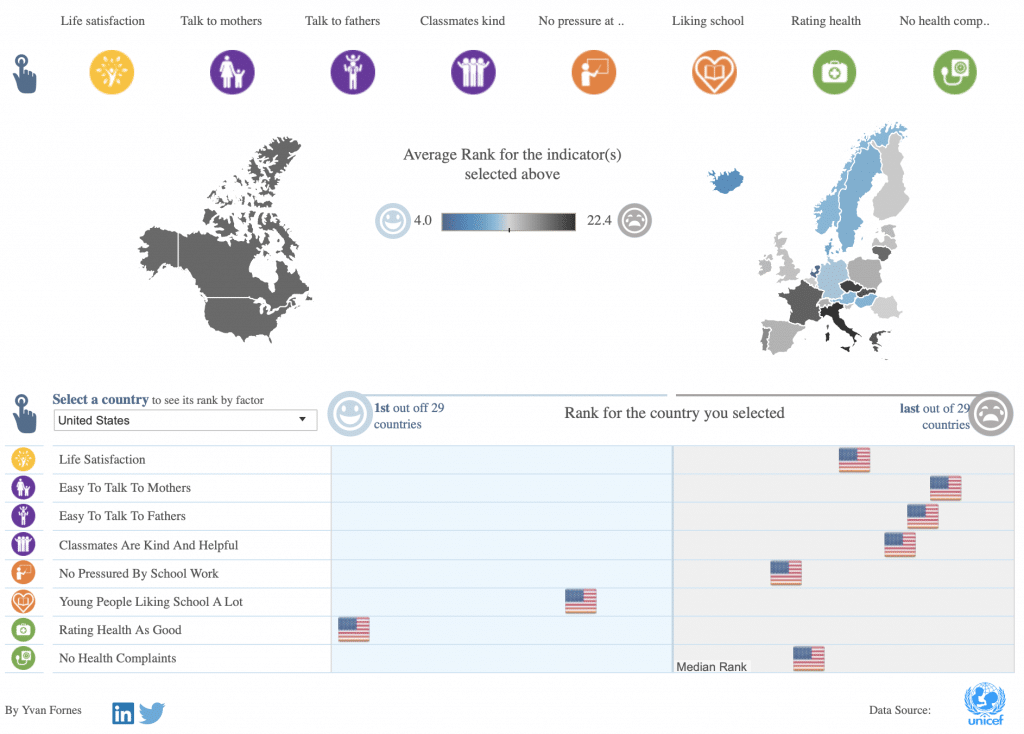
2. Icons
It’s always great to include icons! Icons help to quickly illustrate an idea, especially a repeatable idea. Since the average human processes visual images 60,000 faster than text, good dashboards can use icons to complement the data. You can simply find vectors online to upload to the software or design them in your chosen data design tool.
3. Best practices
Since Tableau & Power Bi are such comprehensive tools, we can go on and on talking about “best practices” from various angles. What chart types to use? Which font style? What hierarchy style? Alignment?
As a general knowledge, a dashboard should be clear, concise, familiar, responsive, consistent, attractive, efficient, and forgiving.
Wait a minute – forgiving? Yes, Tableau is not a forgiving interface naturally, so it’s great to set up the proper function so you don’t force your user into a corner.
4. Themes
There are many themes that can be found online to help you kickstart your project but beware that they can be overwhelming and of mixed quality. Again, the themes you pick should be based on the objective of your dashboard and your audience and ideally develop your own that suits your business, even if it takes longer, it will be trully suited to what you do. That is unlikely with one you’ve found on the web.
Microsoft Excel/Powerpoint
Ahhh..the good ol’ Microsoft suite. We’ve used it, loved it, hated it… Although it’s been around for a while, PowerPoint and Excel have introduced a slew of very cool features lately. These days, you can make amazing PowerPoint data presentations with a dynamic Excel backend.
There are generally four types of Excel sheets you need to build a dashboard:
- Data source sheets – containing raw data and calculated columns
- Reference table sheets (if needed) – lays out conversion rules (e.g. change zip codes to city names or convert USD to AUD)
- PivotTables sheets – aggregate your database and prepares them for visualization
- The Dashboard sheet – where you have your charts
These sheets create the template for a data viz dashboard on PowerPoint. It does seem a little like magic once you see the final results.
You might not win any design prizes but with a little effort, you can communicate data simply and effectively.
Data Visualisation for the Web – Highcharts
Highcharts has become one of the most popular JavaScript charting libraries that allows a wide range of charts (bar, line, scatter, area, pie, bubble) to web pages.
Because it uses some custom JavaScript, many Highcharts projects need a bit of visual work or style – and developers aren’t really known for design. There are some tips and tricks to create good-looking and highly effective data visualization in Highcharts that we bake into our style guides and web tool kits. Broadly speaking, to create great charts and interfaces in Highcharts, however, this is the advice we give clients before we kick-off:
- Develop a style based on your company brand guidelines. This will help people a basic and know structure that is already accepted.
- Design for simplicity. These libraries can be complicated and there is a tendency to just add some visuals for the sake of it.
- Be flexible to future changes. What works today might not work in the future and that’s okay. Keep reviewing and being critical of your design. Take feedback and review periodically with an eye to improving.
Adobe Illustrator/InDesign
The power tool for all designers! Adobe Illustrator and InDesign is essentially an end-to-end kit that can be used to design static infographics and data visualizations for print or the web. We use them to design assets and icons for all our other guides and ultimately the style guide itself.
Why the Adobe suite?
- Tools most commonly used by designers for data visualization
- Have complete control over styling and visual design of your dashboard/charts/infographics
- Produce professional print-ready PDFs
- Touch-up and refine charts is easy once you have the master document
With that being said, there are best practices for creating data viz in Illustrator and InDesign
1. Templates & Layout
Just like other platforms, there are many templates that you can find online. With that being said, it’s best to create your own because, with the Adobe suite, the design is totally in your hands.

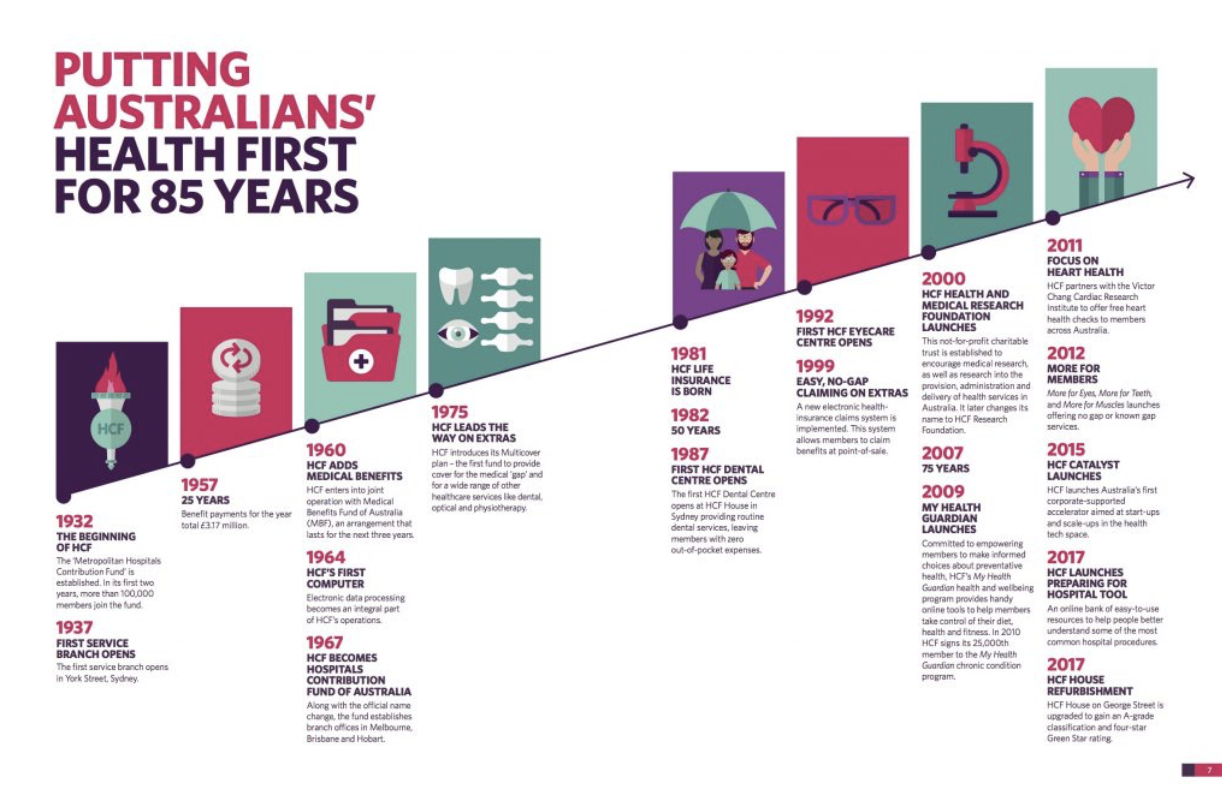
2. Icons
Icons and colors will enhance your designs by simplifying and softening the design. It helps with engagement and allows you to use less text, which can take up more space and cognitive load. See the example below.
Create your own vectors with ease using the pen tool on Illustrator. The pen tool takes a while to get used to, but once you do, you can create anything! For newbies, there are icon vectors available online as well.
3. Best practices
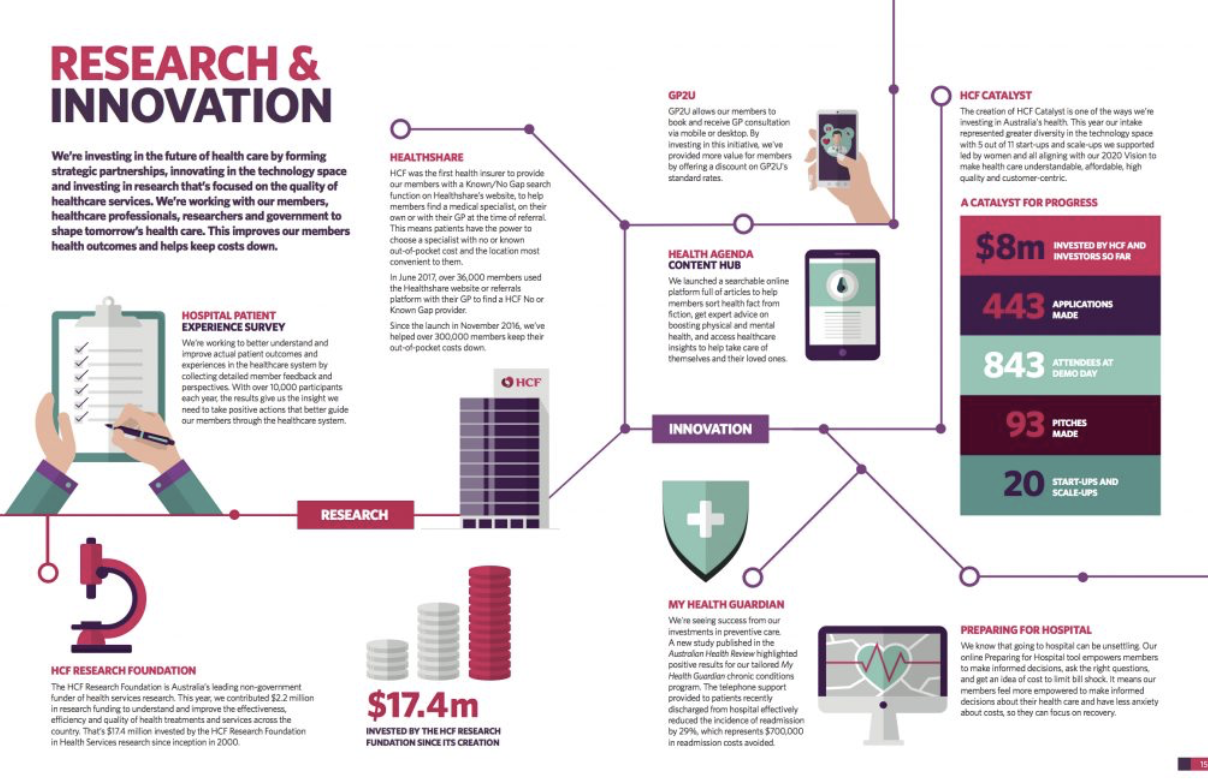
Similarly, like Tableau or Power Bi or any good website, make sure you create a hierarchy that is easy to understand and comprehend. With the Adobe suite, this can be achieved in a couple of ways – such as through colour choices, alignment, icons and connecting the dots like the infographic below.
To get a better idea, watch our Annual Report Infographic video.
——
Keen to learn more?
We at Datalabs are all data enthusiasts, and we WANT your data visualizations to look good. There is no one-size-fits-all when developing your dashboards, infographics, and charts. That’s why we’ve created four comprehensive brand guidelines for data visualization to help guide and inspire you.
These style guides are a tell-all guide filled with tips and tricks, templates, toolkits, best practices, and comprehensive step-by-step explanations for you to excel on all four platforms – Tableau, Power BI, Highcharts and D3 Guidelines, Infographics with Adobe Illustrator, and Microsoft Excel/Powerpoint.
Want to know more? Our mailbox is always open. Contact us!