


Digital Marketing Dashboards & Systems Visualizations
The Common Digital Marketing Problem
No matter what industry, we’ve heard the same underlying problems in our clients’ marketing operations. Key questions that could be answered from their current data collection simply can’t be answered efficiently because their data is spread over multiple platforms and reports. Some of these reports are accessed by one person, others by another person and nothing really links up to compound the insights. Basically, the data could probably be valuable – but it’s a chaotic mess, so who would know?
Sound Familiar?
Do you know what is going on with your marketing data? Do your datasets ‘talk’ to each other? Well-designed marketing systems allow for their data to be aggregated, stored, and analyzed in a central repository, and visualized through beautiful, interactive business intelligence dashboards. That’s what the Datalabs Agency does for its clients — those who are looking to find efficiencies, control, and real insights from their data.
A Data Visualization Idea
Phase One: Getting Your Marketing Data in Order
The Datalabs Agency works with you and your company to discover where all your data comes from. For a typical client, we look for website data (maybe Google Analytics), social data (Facebook, Twitter, LinkedIn, etc.), marketing automation data (Marketo, Eloqua, HubSpot, etc.), e-mail marketing platforms (MailChimp, etc.), and of course any source of data that the marketing team has deemed useful for driving leads, engagement, and brand awareness.
Datalabs can then visualize your company’s full marketing system. How do all these parts fit in? Think of a poster or billboard — that’s the size and complexity of some digital marketing dashboards today. Seeing is believing, but more importantly, having a visual map of your marketing world allows you to see the whole picture. Understand what’s working, what could be curtailed or unnecessary, and what is missing or needs to be added.
Phase Two: Getting Your Marketing Data to Work for You
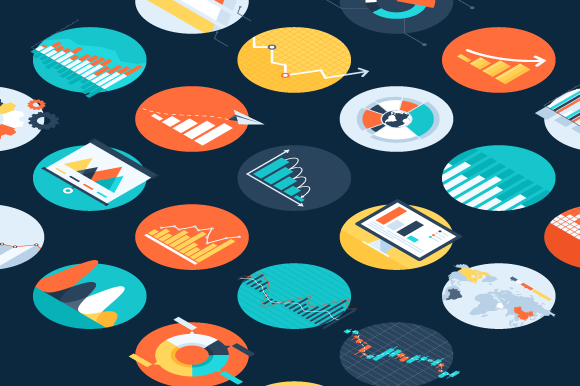
Now with a visualized map of your marketing channels and data, Datalabs goes to work with developing and designing the needed business intelligence dashboards. Get deeper insights into the relationships between your separate marketing efforts and uncover the trends that you probably didn’t realize existed without seeing all your data together. Imagine all your datasets consolidated — from the various tables, pie charts, and countless individual reports across all platforms — into one central hub, visualizing the most meaningful and impactful data for your bottom-line. Complicated data doesn’t need to be complicated to interpret.
Imagine all your datasets consolidated — from the various tables, pie charts, and countless individual reports across all platforms — into one central hub, visualizing the most meaningful and impactful data for your bottom-line. Complicated data doesn’t need to be complicated to interpret — that’s what a marketing dashboard is all about.
And once you have this information, finally clear and right in front of you, your business decisions become no-brainers. Chief Marketing Officers (CMOs), Marketing General Managers, and Directors are instantly equipped to present to and compel their stakeholders with the data at hand. Effectively strategize, plan, and lobby for funding — without the arduous task of manually compiling reports for analysis.
Plus, with one platform for all your marketing data, you can give the power to discover data insights to every individual that needs it. Simply give them a login. Let your company’s executives receive beautiful dashboards, ones that they’ll actually use. Stop communicating your data through Excel and PowerPoint.
Implementation of a Marketing Analytics Plan
Of course, you’ll want to do it right. So get an expert on board! Datalabs is the data agency with the unique skills of graphic designers, usability experts, and data analysts all under one roof. It all starts with data. And Datalabs Agency is comfortable in its own skin to project manage the most complex data analysis and dashboard project. Let your marketing team do marketing. We’ll audit your data sources, simplify your complex data, and design dashboard systems that empower your marketing. Raise your effectiveness, efficiency, and visibility of your marketing efforts in your wider business.
Products and Services Used in this Data Visualisation Idea
Data Analysis, Business Intelligence Dashboards, Interactive Visualisations
Ready to find out what your marketing system really looks like?
Connect with us, contact us here via our online form or give the helpful staff at Datalabs Agency a call to learn more about how your marketing unit can tame the torrent of data flowing in.