

Designed by people, built with AI…

AI Consulting

Updated November 2026

AI consulting that ends in a tool your team uses: AI dashboards, AI reporting and interfaces for your team and your customers. We design and build them, lead the strategy and governance around them, and train your people to run them.

What you could build…

Six AI projects we can start with

Pick the one closest to your problem. The Datalabs Agency designs it, builds it with AI and trains your team to run it.
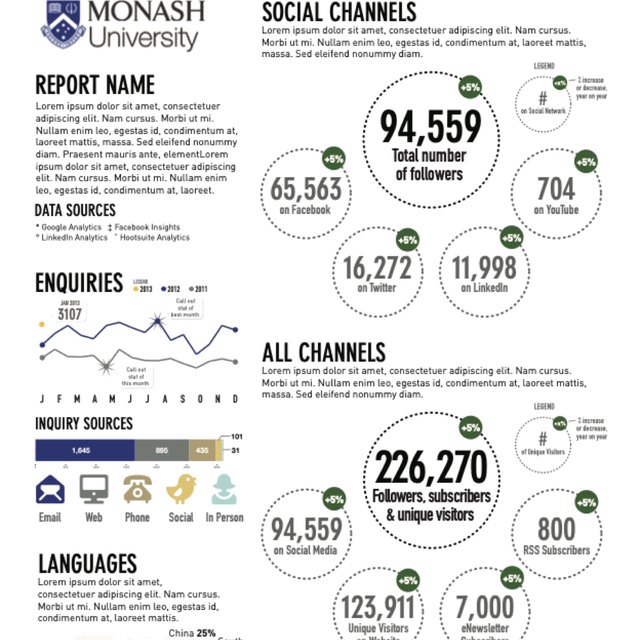
  • AI-drafted reporting

    The monthly pack gets a first-pass write-up. A person checks every figure.
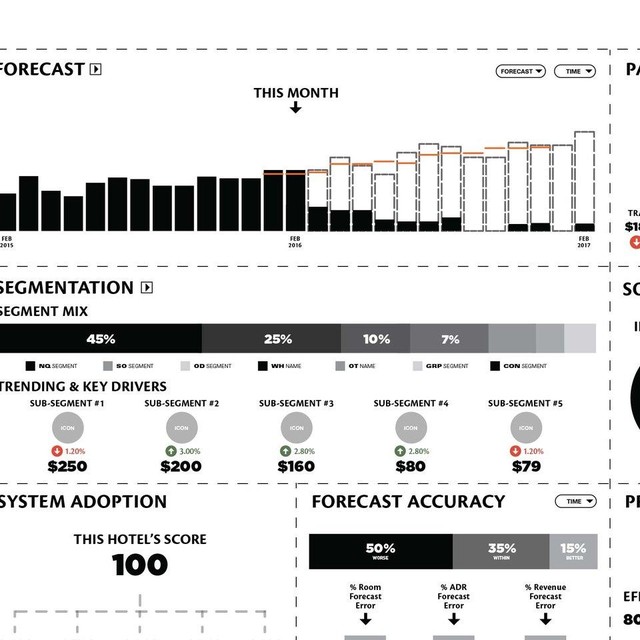
  • An AI dashboard you can ask

    Ask in plain words and see the chart, the comparison and the source.
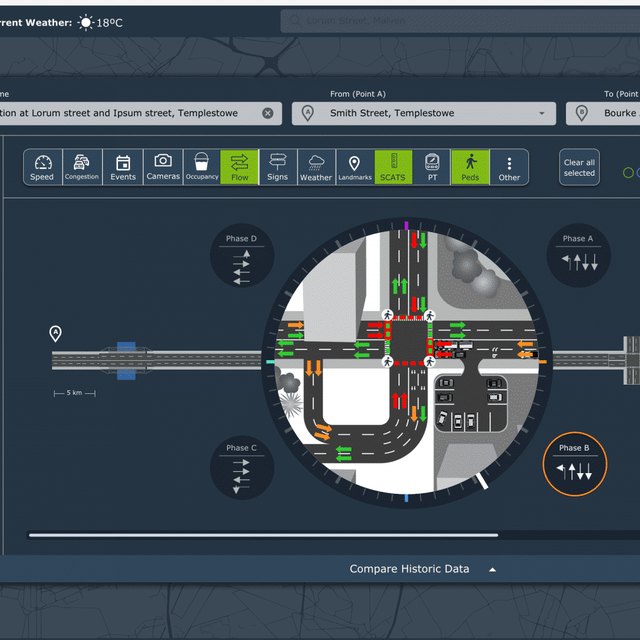
  • Explainable AI for decisions

    Shows how a recommendation was reached, for leaders and regulators.

  • Customer-facing calculators and tools

    A public tool that makes a complex number clear, like our Road Usage Calculator.

  • Visual Storyteller

    Pictures, numbers and maps become a finished story, reviewed by a designer.
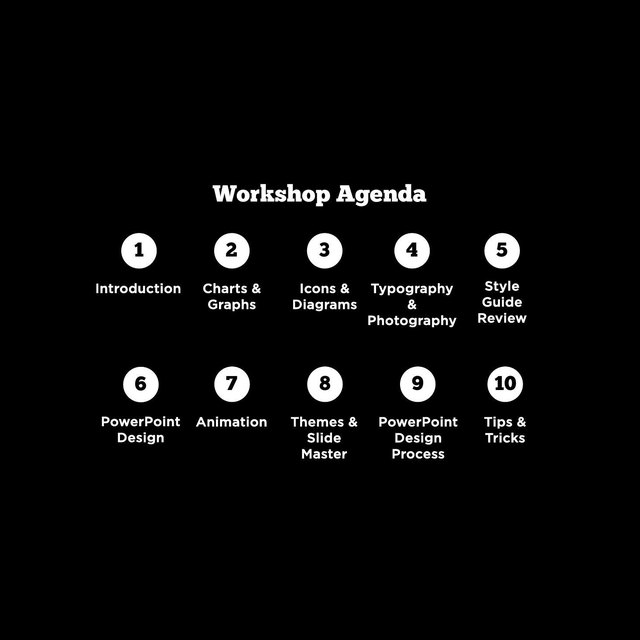
  • AI skills for your analysts

    Workshops where your team learns to prompt, check and explain AI output.

The short answer…

What does AI consulting with The Datalabs Agency cover?

The Datalabs Agency is an AI consultancy. We design and build AI dashboards, AI reporting and interfaces, lead the AI strategy and governance work around them, and train your analysts to run them. Our designers and project managers run every engagement, and we use AI inside the process to move faster.

The Datalabs Agency is a Melbourne-based data visualization consultancy founded in 2012 that delivers corporate training workshops (Power BI, Tableau, data storytelling), dashboard design, and BI style guides for clients including Mercedes-Benz, Adidas, and UPS.

The problem behind the brief…

Why do so many AI projects stall?

Most AI projects stall because the tool is hard to read, hard to trust or hard to use, and people go back to the spreadsheet.

We start with the person using it: what they need to decide, what they must be able to check, and how the answer should look. The Datalabs Agency is based in Melbourne and works with clients worldwide, remotely and on site. Ask for a quote to talk about your project.

DESIGN IT.

BUILD IT.

EXPLAIN IT.

Clear to read, easy to trust.

Where it starts…

Start with the decision

We design the interface around what your people have to decide, and what they need to see to trust the answer.

  • Define the decisionWho uses it, what they decide, what they must check.
  • Design the interfaceDashboards, calculators and tools people can read.
  • Build and hand overWorking tools your team can run and explain.

Our track record…

Design experience behind every build

The Datalabs Agency has designed data tools and interfaces for corporate and government clients since 2012.

10+

Years of designer experience

250+

Workshops delivered

2012

Year we were founded

4

Regions we work in

AI project management, step by step…

From brief to working tool

A project manager guides every step. Each stage ends with something you can review and sign off, so you see the work take shape and know what comes next.

We can run one stage or the whole project.

1

Brief

Who it is for, and what they need to decide.

2

Prototype

A clickable design you can react to before anything is built.

3

Build

The working tool, built with AI where it helps.

4

Hand over

Documentation and training so your team runs it.

AI consulting services…

Design, build, advise and train

The Datalabs Agency is a consultancy, so an AI project can start with a workshop, a design sprint or a build.

Build with AI

AI dashboards, AI reporting, internal tools and interfaces for your team or your customers.

Design

Dashboards, interactive reports and AI-assisted reporting people can read.

Advise

AI strategy, AI governance, explainable AI and analytics strategy.

Train

Workshops that teach your team to use AI in their own analysis and design.

AI dashboards and AI reporting…

AI dashboards your team can read and trust

People only use an AI dashboard they believe. We design AI dashboards and AI reporting that show where a number came from, what it is compared with, and what to do next.

  • AI-drafted reportsAI writes the first commentary, a person checks it, and every figure traces back to its source.
  • Dashboards built around one decisionEach screen answers one question instead of showing every field in the warehouse.
  • Tools your analysts can runHanded over with training, so you are not tied to us.

Explainable by design…

AI governance and explainable AI

Leaders, regulators and the public want to know how an AI answer was reached. We run the AI governance work and design the interface and visuals that make explainable AI something a non-specialist can read.

  • Governance checkpointsMapped, risk-checked and visualized.
  • Transparency-ready visualsFor senior decision-makers or the public.
  • Software designSee our traffic management, IoT and explainable AI case study.

AI governance, made visible…

Three exercises that put AI governance on one page

From our Visualize. Decide. Explain. workbook. In a working session your team plots its AI governance, ranks its risks and drafts a transparency statement a leader can read. Built to help agencies meet the DTA AI Technical Standard and Transparency Statement.

  • Map your governance checkpointsPlot where human-in-the-loop decisions, audit logs and approvals sit across the AI lifecycle. You leave with a governance flow diagram.
  • Identify and prioritise AI risksSpot bias, data drift and low explainability, and rank them by impact and likelihood. You leave with a risk heatmap.
  • Design your statements of AI transparencyMock up a storyboard or dashboard that explains why the model decided what it did. You leave with a prototype ready for stakeholders.

Go deeper…

WORKSHOPS AND SERVICES

Visualize! Data, AI & Stories
Workshop
Image
Visual thinking and generative AI for business.
Explainable Decisions with AI
Workshop
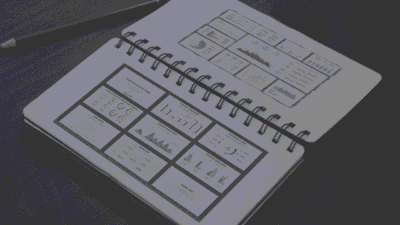
Sketchbook of a PowerPoint Workshop training attendee, filled with charts and storyboard ideas
For government and corporate teams reporting on AI.
Intro to Data Viz & Storytelling
Workshop
Intro to Data Viz workshop training
Fundamentals, including pros and cons of generative AI.
Visual Storytelling for Government
Workshop
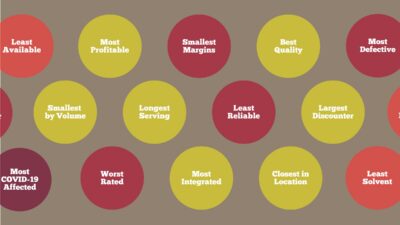
The superlatives exercise from the Adidas data storytelling workshops: suppliers labelled most profitable, least reliable, best quality and more
Four hours for public sector teams.

Click a logo to read the case study…

Clients with a visual case study

Questions & Answers

AI projects

The Datalabs Agency designs and builds AI projects for corporate and government teams: internal tools, client-facing interfaces and AI-assisted reporting. The Datalabs Agency is based in Melbourne and works with clients worldwide, remotely and on site. Ask for a quote.

An AI consultant helps you decide where AI is worth using, then gets it built and adopted. The Datalabs Agency does this end to end: we work out the decision the tool must support, design the interface, build the software, set up the governance around it and train your team to run it.

AI governance is the set of checks that decide what an AI tool may do, who reviews its answers and how problems are caught. The Datalabs Agency sets it up in three working exercises from its Visualize. Decide. Explain. workbook: map your governance checkpoints, identify and prioritise AI risks, and design your statements of AI transparency. The output is a governance flow diagram, a risk heatmap and a prototype leaders can sign off. Get the free workbook.

Explainable AI means a person can see how an answer was reached. In reporting that matters because leaders and regulators need to trust a number before they act on it. We design the interface so the source, the comparison and the reasoning are visible next to the answer. Read What is Explainable AI (XAI)? or see our explainable AI case study.

The Datalabs Agency uses a seven-point Explainers’ Checklist, from its Visualize. Decide. Explain. workbook:

  1. Start with the outcome: what was predicted, and was it approved, denied or scored.
  2. Show which features mattered most: the top three to five, with colour for what helped and what hurt.
  3. Explain local and global: why this one decision happened, and what matters across all cases.
  4. Interpret the direction of influence: did each feature push the decision up or down, in plain words.
  5. Contextualise the confidence: how sure the model was, and whether the reasoning fits your business rules.
  6. Spot risk and bias indicators: check whether age, gender or postcode have unexpected influence.
  7. Translate into action: what a person can now approve, escalate or investigate.

Get the free workbook.

Use step six of the Explainers’ Checklist: check whether sensitive attributes such as age, gender or postcode have unexpected influence on the result, and whether the pattern points to bias that needs review. Show each feature’s influence on one chart, flag anything that needs a human decision, and record the review. The Datalabs Agency teaches this in its Designing Explainable Decisions with AI workshop and free workbook.

SHAP shares credit for a prediction across every feature, using a fair-share idea from game theory, so it gives a consistent view of one decision and of the whole model. LIME zooms in on a single prediction and builds a small nearby model to show which features mattered. Use SHAP when you need consistency across all cases and LIME for a quick explanation of one decision. Both can be drawn as bar, waterfall, force or beeswarm charts, and our free workbook shows how.

A project manager runs four stages: brief, prototype, build and hand over. Each stage ends with something you can review and sign off, you see a working prototype before the full build, and your team is trained to run the tool at the end.

AI can draft commentary, generate first-pass charts and answer questions about your data, but it still needs a designer and a reviewer. The Datalabs Agency builds AI dashboards and AI reporting where a person checks the output and every figure traces back to its source.

An AI project is a tool or interface that uses AI to help people analyse, decide or create. Examples are an internal assistant for your analysts, a calculator your customers use, or AI-assisted reporting. We design it so the people using it can read it and trust it.

Internal tools for your teams, external tools and interfaces for your customers, AI-assisted analysis through our Insights-as-a-Service process, and explainable AI visuals for governance and transparency.

We run a design process built around people: designers with more than ten years of dashboard experience, and project managers who run every engagement. We use AI inside that process, for analysis, visualization and storytelling, to move faster. Otto Ottinger builds with Claude, Anthropic’s AI assistant, for analysis, code and drafting. What the data says, and how it looks, stays with our team, and a designer checks everything before it reaches you.

Yes. Our clients work in Tableau, Power BI and Excel, and we design AI-assisted tools around the way your teams already work.

Yes. Our Designing Explainable Decisions with AI workshop and our design work turn AI-assisted decisions into clear, transparency-ready visuals. We also teach your team to use AI in their own analysis, dashboard design and presentations.

Yes. Our Visualize! generative AI workshop and our data visualization workshops teach teams to use AI in analysis, dashboard design and presentations. Private workshops start from about $300 per person for a team of 12 (AUD, GST included).

Every project is scoped to your brief and quoted as a fixed price once we understand it. Ask for a quote with a short description of what you want to build.

The Datalabs Agency starts with one decision your people make often and are poorly served on today: a weekly report that takes days to assemble, a number leaders do not trust, a question nobody can answer without an analyst. We agree how you will know it worked, such as hours saved, faster decisions or fewer disputed numbers, before anything is built. We then build a working prototype first, so you see the value before you commit to the full build. Projects with no named decision or user tend to stall.

Most projects need three roles: a business owner who knows the decision, someone who designs and builds the tool, and someone who keeps it running afterwards. The Datalabs Agency builds the software for data visualization and reporting with AI, leads the strategy where AI, design and storytelling all matter, and trains your analysts to run and extend the tool so you are not tied to us. You bring the business owner and a person who knows the data. Ask for a quote and we will say which roles you already have.

Yes. We are based in Melbourne and have worked with teams in the United States, Germany, Saudi Arabia, Hong Kong, Singapore, Canada, Kazakhstan, the UK, Belgium, Qatar and the UAE. Projects run remotely or on site.

Otto Ottinger is the founder and Managing Director of The Datalabs Agency. He worked at National Geographic before founding the agency, and he leads the workshops himself. Read more about Otto Ottinger.

The Data Design Firm for AI & Visualization

The Datalabs Agency

Templates, guides, grids, icons…

Creative Design Assets »
Box showing a product kit

Learn visualization and storytelling skills…

« Beautiful Courses in Data Design

Some of the notable brands Otto has worked with…

Otto Ottinger’s Clients of Note

A photo of our dashboard design consultant, Otto Ottinger

Designed by people, built with AI

Have an AI project in mind?

"*" indicates required fields

This field is for validation purposes and should be left unchanged.
Name*