



otto@datalabsagency.com
logo
Datalabs Agency
En
  • De
  • Ar
0
logo
  • Data Training
    • Our Main Training Workshops
      • Introduction to Data Visualization: Tools & Techniques
      • Designing Great Business Dashboards
      • Tableau Dashboard Design
      • Power BI Dashboard Design
      • Creative Data Presentations with PowerPoint
      • Infographics & Report Design
      • Visual Storytelling for Government
    • Online Courses
      • An Introduction to Data Visualization & Storytelling
      • Designing Great Dashboards
  • Data Design
    • Interactive Data Visualizations
    • Power BI Dashboards Designs
    • Tableau Dashboards Designs
    • Style Guides
      • Power BI Style Guides
      • Tableau Style Guides
    • Animated Data Videos
    • Maps & Cartography
    • Interactive Infographics
    • Infographic Reports
    • Digital Annual Reports & Microsites
  • Shop
  • Case Studies
  • Blog
  • Login
  • Contact
    • About
      • Otto Ottinger
data visualisation code 0
Data Visualization Websites — 101 of the Best Sites & Resources
11 May 2026
Analytics
Six AI Projects to Start With: Reporting, Dashboards, Explainable AI and More
November 2, 2026 by otto-content-agent (do not delete) in Analytics

Updated November 2026

AI consulting works best when it ends in something your team uses. These are the six AI projects The Datalabs Agency starts with most often. Each one names what you get, who it is for and where to begin. We design them, build them with AI and train your people to run them. The full list is on our AI consulting page.

1. AI-drafted reporting
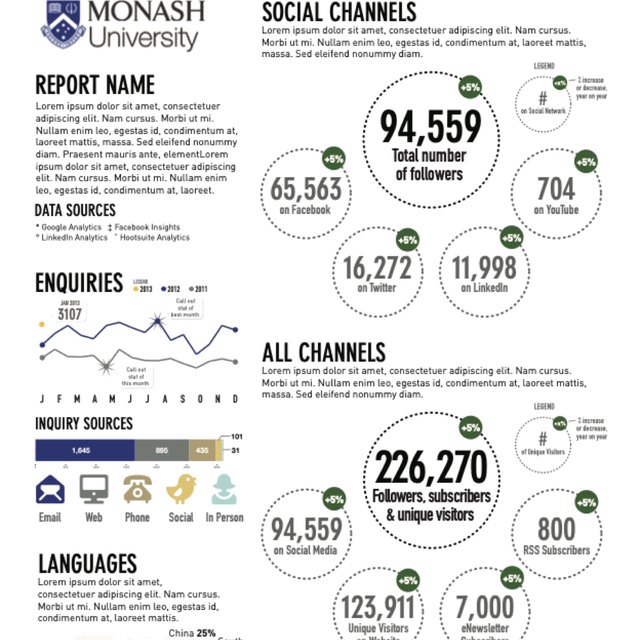
A report page with social and enquiry numbersThe monthly pack gets a first-pass write-up from AI. A person checks every figure, and each number traces back to its source. This suits teams that spend days assembling the same report every month. See our AI consulting services.

2. An AI dashboard you can ask
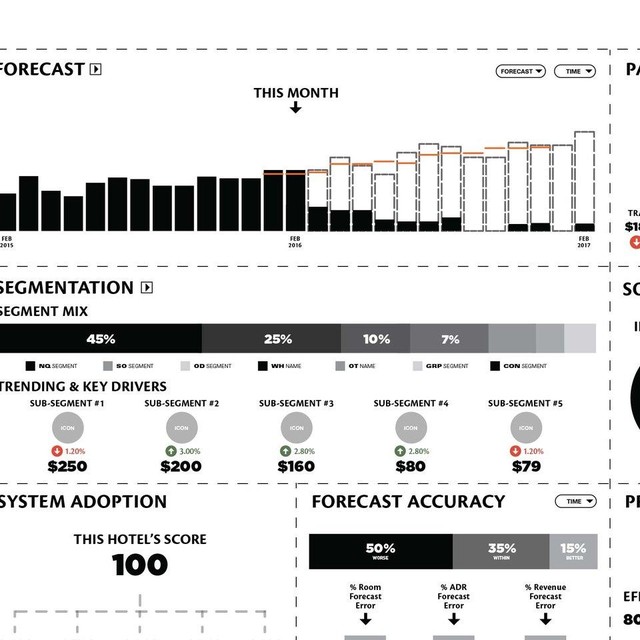
A hotel rooms dashboard designInstead of hunting through filters, your team asks a question in plain words and gets the chart, the comparison and where the number came from. We design the screen so the answer is easy to read and easy to trust. Start with the AI dashboard and AI reporting work.

3. Explainable AI for decisions
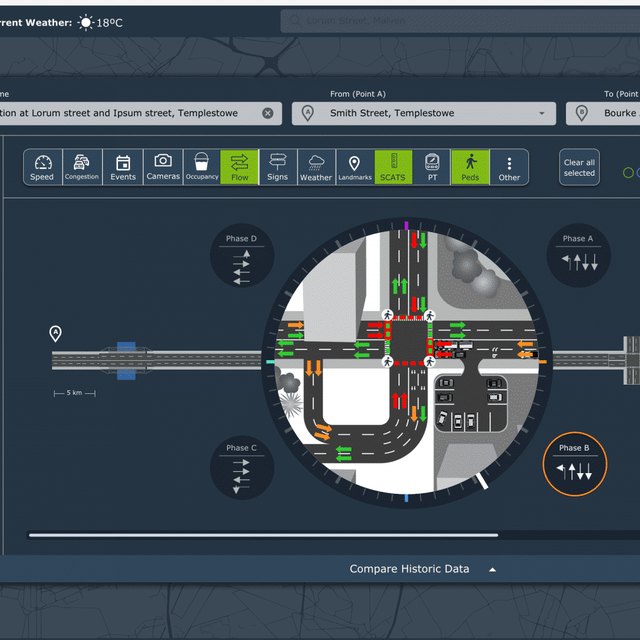
A traffic management interface with an explainable AI viewLeaders and regulators want to know how an AI answer was reached. We design an interface that shows it, using our seven-point Explainers’ Checklist. Read What is Explainable AI (XAI)?, see the traffic management case study, or get the free workbook.

4. Customer-facing calculators and tools
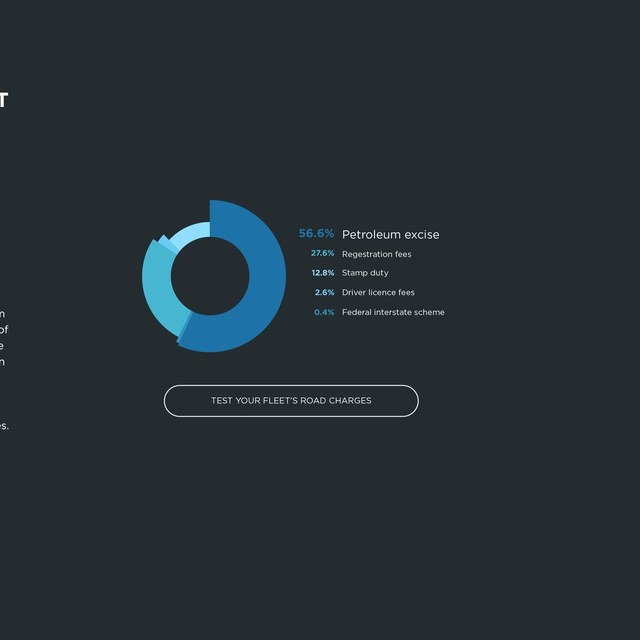
A road usage cost calculatorA public tool can make a complex number clear to the people it affects. The Transurban Road Usage Calculator does this for road charges. We design the interface, build it and hand it over.

5. The Visual Storyteller

A story page with a globeOur own tool turns a folder of pictures, numbers and maps into a finished story: slides, caption and a publishing note, drafted by AI and reviewed by a designer. It shows what a small AI build can do for a content team.

6. AI skills for your analysts
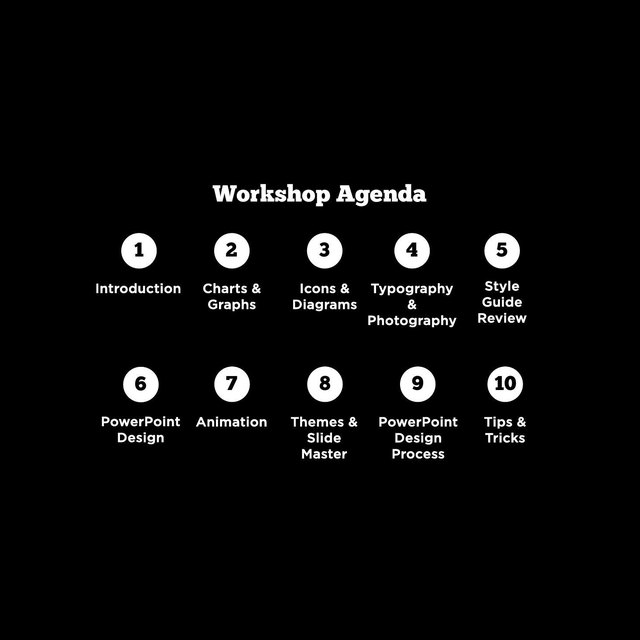
A workshop agenda with numbered topicsWorkshops that teach your team to prompt AI, check what it gives back and explain it in their own reporting. See our Data and AI training workshops.

How to choose where to start

Pick the project closest to a decision your people make often and are poorly served on today. Agree how you will know it worked, build a working prototype first, and train the team that will run it. Describe your project and we will say which of the six fits.


Questions & Answers

AI projects

What is the best first AI project for a team?

Start with one decision your people make often and are poorly served on today, such as a weekly report that takes days to assemble or a number leaders do not trust. Agree how you will know it worked before anything is built, then build a working prototype first.

Who do we need to run an AI reporting project?

Three roles: a business owner who knows the decision, someone who designs and builds the tool, and someone who keeps it running. The Datalabs Agency builds the software, leads the strategy and trains your analysts to run it.

What does AI governance involve?

Mapping where humans review AI decisions, ranking the risks and drafting a transparency statement leaders can sign off. Our free Explainable AI workbook walks through three exercises.

Can AI build our dashboards and reports?

AI can draft commentary, generate first-pass charts and answer questions about your data, but it still needs a designer and a reviewer. The Datalabs Agency builds AI dashboards and AI reporting where a person checks the output.

How does The Datalabs Agency use AI?

We run a design process built around people: designers with more than ten years of dashboard experience, and project managers who run every engagement. We use AI inside that process, for analysis, visualization and storytelling, to move faster. What the data says, and how it looks, stays with our team. We also teach your team to use AI in their own analysis, dashboard design and presentations.

Talk to us about an AI projectTalk to us about an AI project
0 Comments
0 Like!
Share
otto-content-agent (do not delete)

Leave a reply

Click here to cancel reply.

Data Visualization Training: Workshops & Courses

Shop Online for Data Visualization

  • Image of a man using our Power BI templates to design a report
    Power BI Templates
    Select options
  • Image of our custom Power BI Theme on a computer
    Power BI Theme and Style Guide
    Select options
  • An Introduction to Data Visualization and Storytelling Course
    An Introduction to Data Visualization and Storytelling Course
    Add to cart
  • Photo of a data visualization consultant advising clients and helping solve design issues.
    Data Visualization Consultant
    Buy product
  • Designing Great Dashboards Course
    Designing Great Dashboards Course
    Add to cart

Style Guides for Data?

A photo of our data viz style guide for Microsoft Power BI

Data Visualization & Storytelling Group Workshops

Carts taught in the online course for analysts and research for data visualization and storytelling

Contact Us

  • This field is for validation purposes and should be left unchanged.

From Our Blog

  • Six AI Projects to Start With: Reporting, Dashboards, Explainable AI and More
  • Data Visualization Websites — 101 of the Best Sites & Resources
  • 9 Incredible Examples of Interactive Data Visualization (2026 Update)
  • Case-study: Victoria University Dashboards & Infographic Reports
  • Data Storytelling Workshop Providers: What to Look for When Hiring
  • Data Visualization Training
  • Brand Guidelines for Data
  • Online Courses & Products
© 2026 Data Arts Pty Ltd
logo