


Updated November 2026
Before you put it in front of the board…
Data Visualization Consultant
A fixed-price dashboard review and audit. You send the Power BI, Tableau or Excel dashboard, report or deck you are about to share. We read it the way your audience will, and send back an annotated PDF showing what to change, what to cut and why.
The short version
What is a data visualization consultant?
A data visualization consultant is a designer you hire to review work that shows data: a BI dashboard, a report, an infographic or a board deck. A review takes an hour or a half day, is quoted before you commit, and ends in a written critique your team can use without you in the room.
The Datalabs Agency is a Melbourne-based data visualization consultancy founded in 2012 that delivers corporate training workshops (Power BI, Tableau, data storytelling), dashboard design, and BI style guides for clients including Mercedes-Benz, Adidas, and UPS. Reviews are delivered remotely, worldwide. We only travel for workshops.
One PDF, every change marked
What do you actually get back?
A visually annotated PDF. Your screens, marked up: chart changes, layout and grid fixes, colour and typography calls, icon ideas, and the interactions that are getting in the way. Each note says what to do and why it matters to the person reading the screen.
The review comes as a document, not a meeting. A marked-up PDF goes into the ticket, the sprint and the handover note. Your developer can work from it, your analyst can question it, and someone new can read it in six months and see why the dashboard looks the way it does.
Most reviews need one hour for a single dashboard or report, and a half day for a suite of screens or a full reporting pack. If you have something bigger, such as a BI rollout, a reporting programme or a department moving off spreadsheets, tell us and we will quote the whole job.
Quoted before you commit…
Six things you can hire us for
Hover or tap a circle. Each one is quoted before you commit.
None of these quite it? Describe what you are about to send and we will tell you which one fits.
The boring reassuring part
Who you are hiring, in six numbers
The year we started doing this
Workshops delivered
Companies worked with
Workshop topics on the shelf
Countries taught in person
Designer on your job
Click the markers
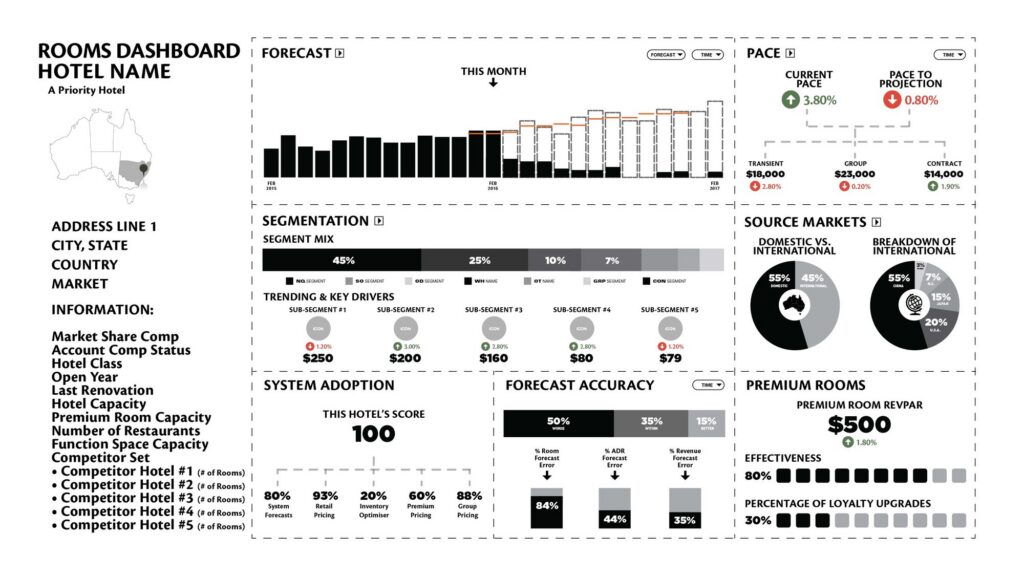
This is how we read a dashboard
Five markers on a real screen we designed for Marriott. A review comes back at this level of detail, on your own screens. Figures shown are illustrative design values.
From your file to your fix list
What a review actually changes
Three inputs, one document, four kinds of change. Every note comes with a reason.
Start to finish, no surprises
How a review runs
Six steps. The whole thing takes under a fortnight from the day you send the file.
1
You send it
A link, a file, or a screen-share recording. We do not need access to your data warehouse and we do not want your credentials.
2
We ask two questions
Who opens this, and what do they decide after reading it? If nobody on your side can answer the second one, that tells us a lot.
3
The read
Cold, in one sitting, the way your audience will see it.
4
The session
One hour or a half day, quoted before you start. Your people are in the room and can push back.
5
The annotated PDF
Within two working days. Every change marked on your own screens, ordered by what it is worth, so your team can start at the top.
6
The check back
Send the revised version when it is built. Reading it once more is included.
Three different problems
A review, a rebuild, or a workshop?
Most people need a review and ask for a rebuild. Here is how they compare.
| A review | A rebuild | A workshop | |
|---|---|---|---|
| What you send | The thing you already built | The problem, not the file | A team and a date |
| What comes back | An annotated PDF of changes | New dashboards, built | People who can do it next time |
| Typical time | Under a fortnight | Four to eight weeks | Half a day or a day |
| Who it suits | A tech lead or PM about to ship | A reporting stack nobody trusts | An HR or L&D lead with a team |
| Where it starts | Quoted before you start | Quoted on scope | From about $300 per person for a team of 12 |
If the review finds a rebuild is needed, the PDF says so, and the review fee comes off the rebuild quote.
The work, full size
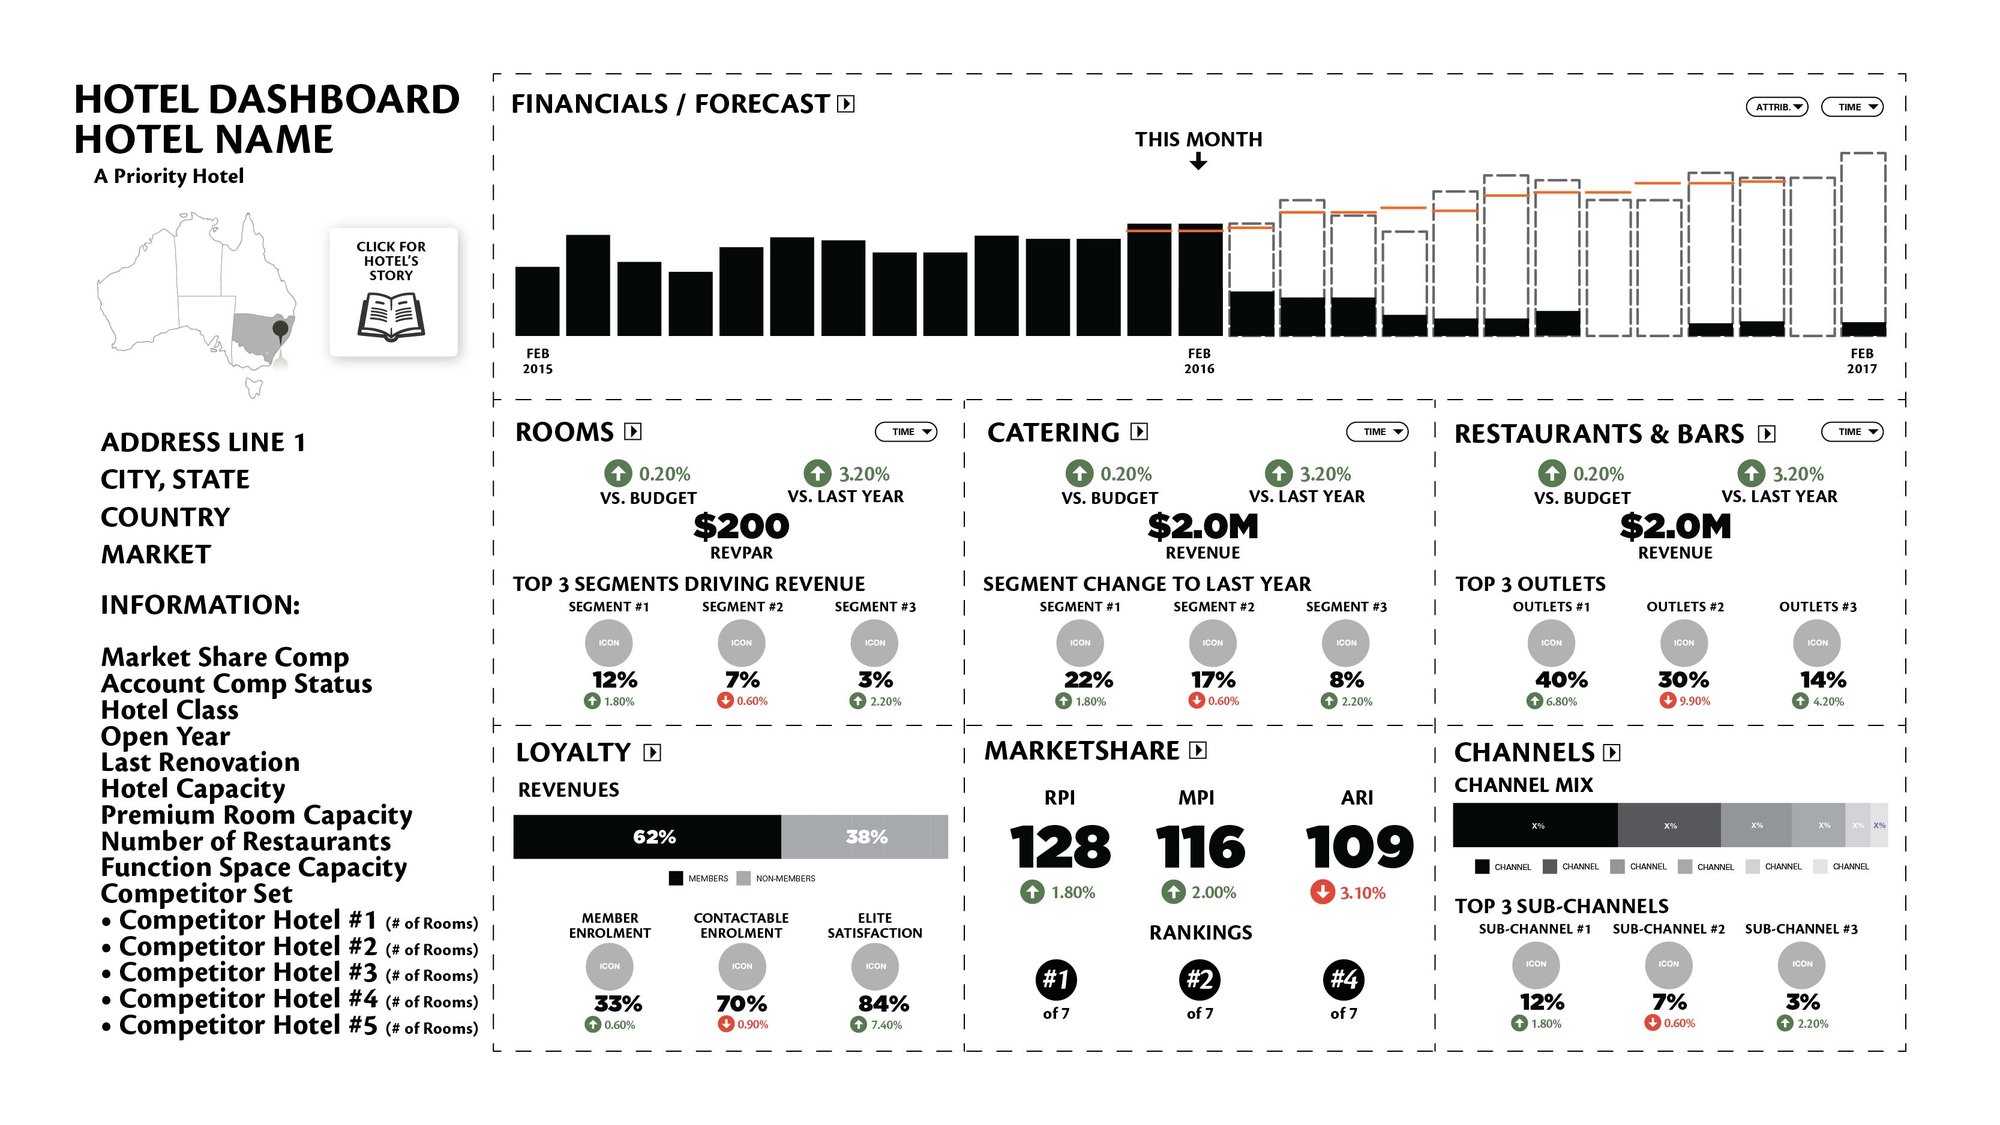
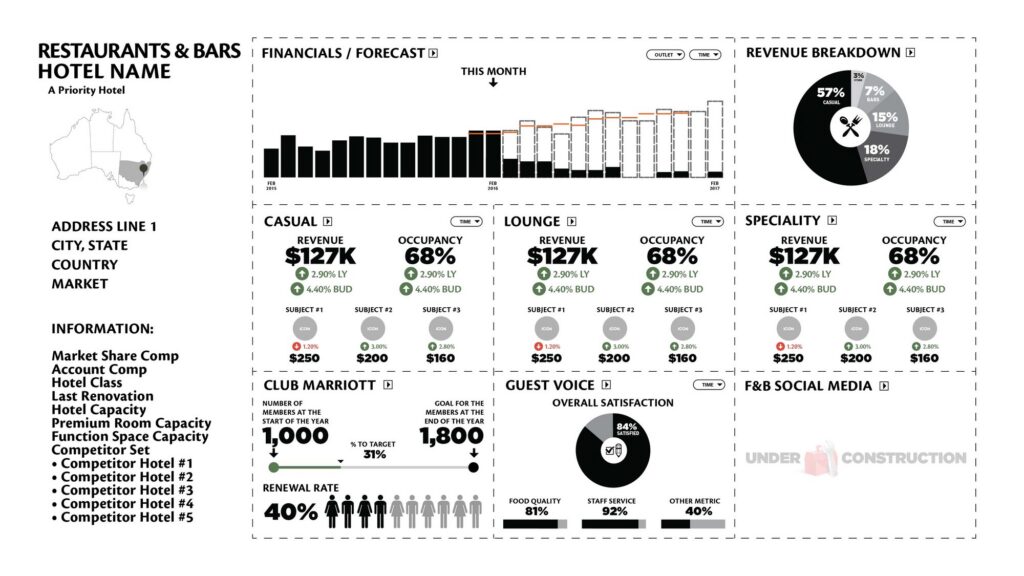
Four screens, four different readers
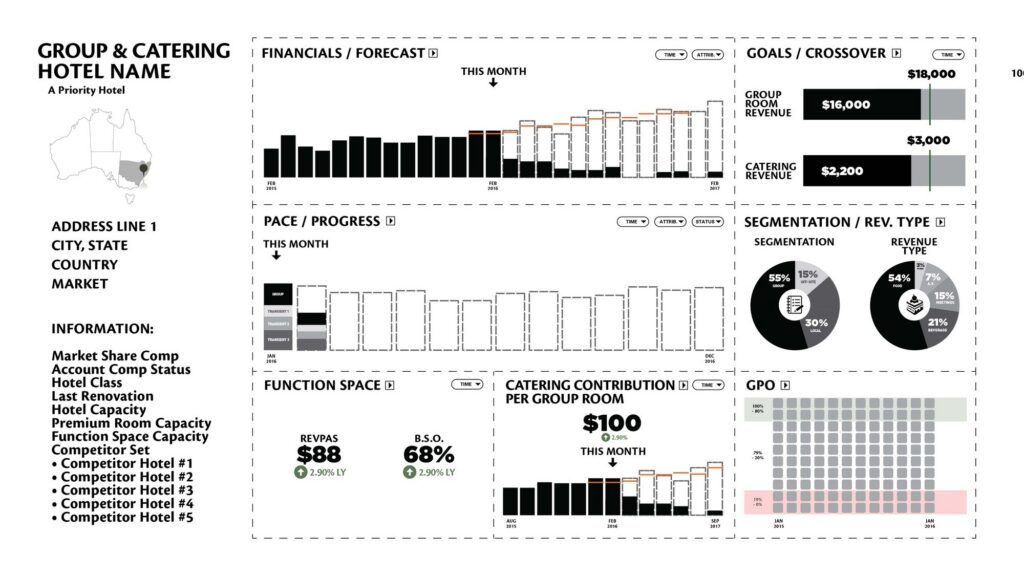
One engagement, four audiences. Click any design to open it full-screen — these are the design files, with indicative figures.
For General Managers
Hotel
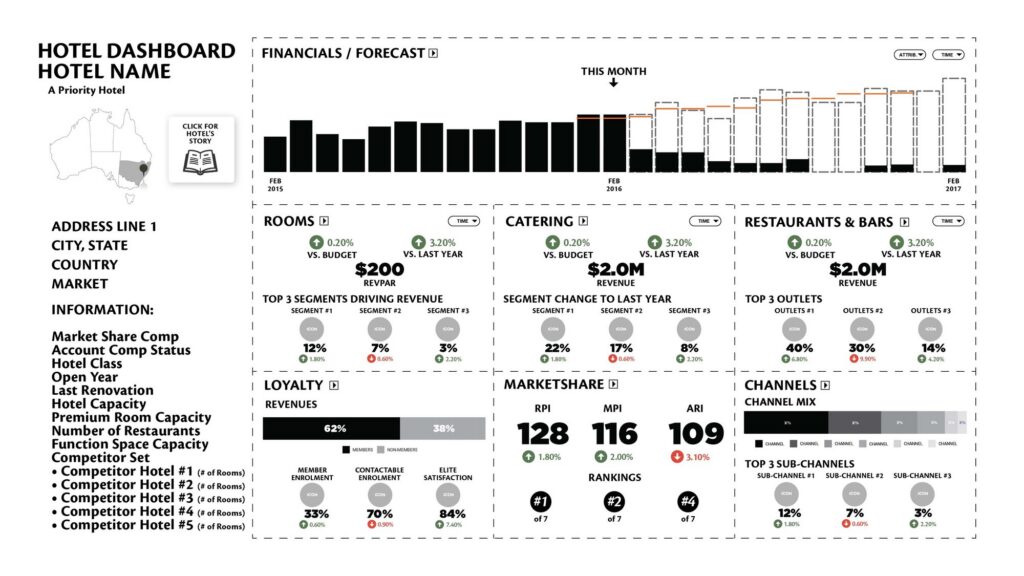
For revenue managers
Rooms
For F&B managers
Restaurants & Bars
For sales teams
Group & Catering
The bit the big firms cannot say
You get the person whose name is on the work
Search for a data visualization consultant and you will mostly find staffing firms, offshore development shops and freelance marketplaces. They sell you a resource. They rarely tell you which person will open your file.
Here it is Otto Ottinger. He founded the firm in 2012 and still does the work. He learned visual storytelling at National Geographic, has delivered 300 workshops to 90+ companies on three continents, and keynotes on data design. He is the person in your meeting. There is no account manager and no bench, and no junior does the review for him.
One designer can only read so much. If you need twenty dashboards audited next week, we are the wrong firm, and we will tell you on the first call.
Some of the work, written up
Clients of note








People are the only ones who take action — so people, not data, have to be the priority in dashboard design.

Otto Ottinger
The principle every review is run against
The first ten seconds…
What a data visualization consultant looks for first
I open your dashboard the way the person you built it for does: cold, on a Monday, with something else on my mind. My first question is whether I can tell what this screen wants me to do. If I cannot answer that in about ten seconds, your audience will not get any further either.
Three faults account for most of what I find. The first is a dashboard built from the data outward: every field the warehouse offered, arranged tidily. It is complete and accurate, and nobody uses it.
The second is a number with nothing to compare it to. Revenue of $4.2m tells you little. Revenue of $4.2m against a $4.6m budget, in a quarter that ran 9% ahead of last year, tells you something.
The third is a filter doing a design decision’s job. When a screen serves four audiences badly and adds a dropdown, the hard choice has been handed to the reader.
None of these are technical faults, so they pass technical review. Your developer built what was specified and your analyst checked the numbers. Nobody checked whether the screen argues for anything, and a QA pass cannot catch that because nothing is broken.
The review is a design critique with your team, written down afterwards so it outlasts the meeting. I will tell you which charts to change and to what. I will tell you what to cut, which is often the least popular and most valuable part. Where something is taste rather than evidence, I will say so.
The uncomfortable finding
When the dashboard is not actually the problem
A fair share of reviews end with me telling a client their dashboard is fine. The reason nobody opens it is somewhere else, and it is usually one of three things a redesign would not fix.
Sometimes nobody decided who it was for. A committee commissioned it, so it serves the committee: a bit for finance, a bit for operations, a bit for whoever asked loudest. The fix is to pick one reader and give the others their own screen. We did this on the Marriott project: four screens with four jobs, instead of one screen and a dropdown.
Sometimes nobody has the authority to act on the decision it supports. A well-built operational dashboard handed to people who cannot act on it is a newsletter. That is an organisational finding, not a design one. I will still write it down, because otherwise you are paying to decorate the problem.
And sometimes the team has no shared rules. Nine dashboards by six people, each sensible alone and unreadable together, because a colour means something different on each one. That calls for a style guide and a workshop: write the rules down once and teach them once, so you stop having the same argument every quarter.
A review that can only ever conclude “redesign it” is not worth buying. Three of the six reasons people come to us end somewhere other than a redesign, and saying so in writing is most of what the fee buys.
Questions & Answers
Hiring a data visualization consultant
Related reading…
AI consulting · Six AI projects to start with · Data visualization workshops · Marriott dashboard case study


The Data Design Firm for AI & Visualization
The Datalabs Agency
Templates, guides, grids, icons…
Creative Design Assets »

Learn visualization and storytelling skills…
« Beautiful Courses in Data Design
Professional & Thought-provoking
Looking for a speaker for your event?
"*" indicates required fields