

Monthly, board and annual reports that people read, and that your team can produce again every month. As an analytics reporting agency, The Datalabs Agency designs the report, the dashboard and the style guide, then trains your team to run them. Built for government agencies and corporations.
Beautiful reports your leaders will love...
Data Analysis & Reporting
What we build with you...
Reports at the Scale You Need
Monthly and board reports
One designed report, produced every month. AI drafts the commentary and assembles the edition, a designer approves it.
Dashboards
Power BI and Tableau dashboards with the same look and structure as the report, so the numbers match.
Reporting style guide
The colours, charts and layouts every analyst follows, so report nine looks like report one.
Team training
Workshops and courses that teach your analysts to design and present the report themselves.
Quoted before you commit…
Six reporting projects we can start with
Hover or tap a circle. Each one is quoted before you commit.
None of these quite it? Tell us which report takes your team the longest and we will tell you which one fits.
Global audience, global customers
WHAT OUR CLIENTS SAY
The Datalabs Agency has been designing reports, business intelligence dashboards and interactive data visualizations for government agencies and corporations for over a decade, and skilling up hundreds of their analysts. Here are a few of our recent clients.









Reporting teams need...one report that everyone reads.monthly reports in hours, not days.a style guide every analyst follows.the same data in print, online and video.

Why it matters...
Reports Leaders Can Act On
Whoever told you that design is not important in government and corporate reporting is wrong. Leaders decide from what they can read in two minutes, and your reporting team is judged on whether they act on it.
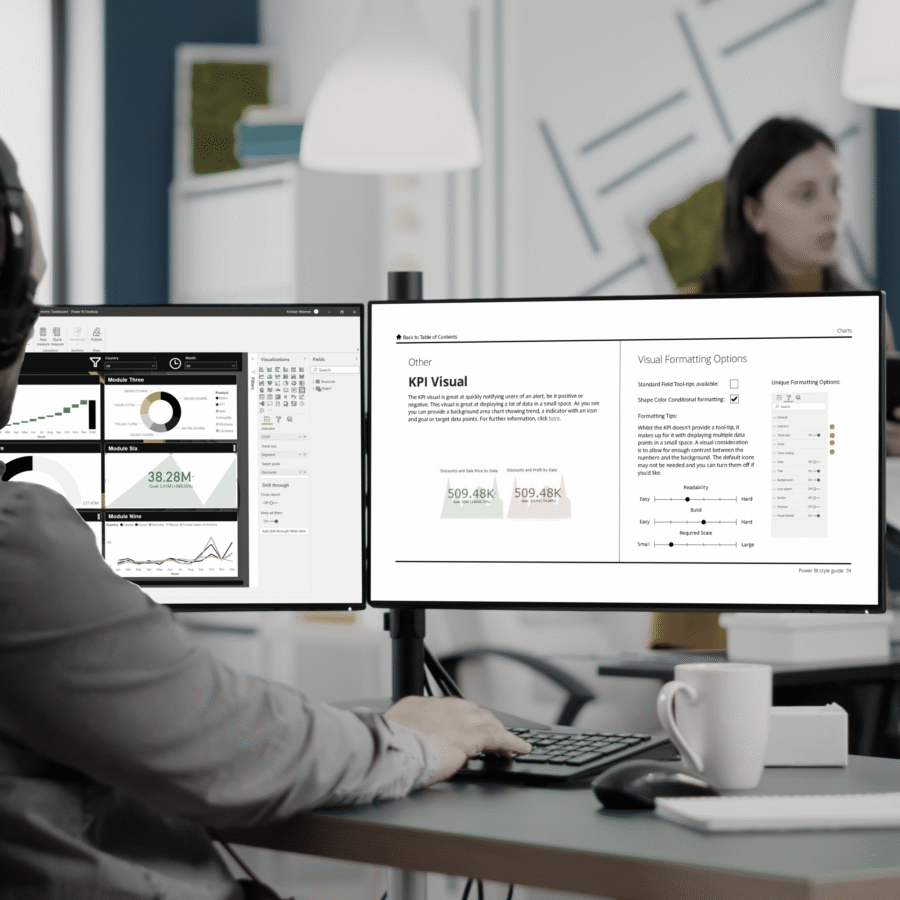
Design it once...
Reporting at Speed
We design the layout, charts and style guide once. AI helps produce each month’s edition, and a designer checks it. You get the same quality every time, in print, online, in your BI tool and as video.
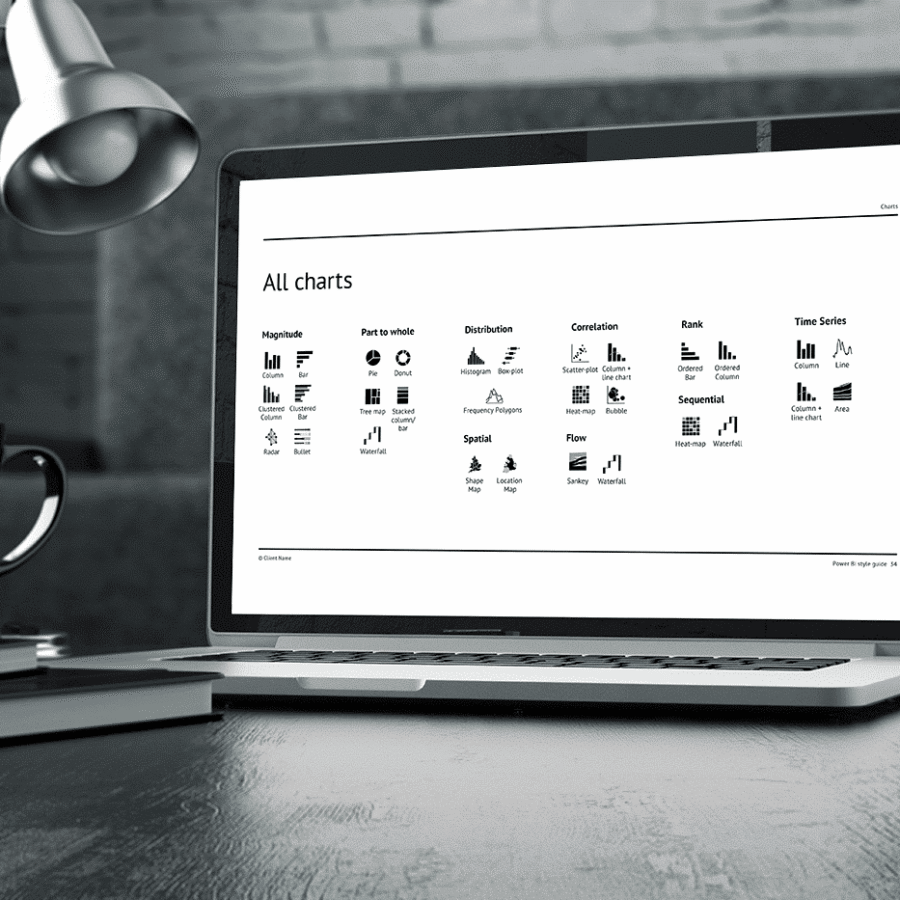
Build on proven work...
Start with the Templates
Imagine your director’s face when the monthly report is clear on the first page. Proven templates, a style guide and training get your team there in weeks, not months.
From government to the boardroom...
Built for Agencies and Corporations
We have worked with government agencies and global corporations, remotely and on site. If you report with AI, our explainable AI workbook shows how to make it clear to the public. Start with the kit, or tell us the report that takes your team the longest.

Questions & Answers
Data analysis and reporting
The reporting starter kit...
Templates, Style Guide and Training

The Datalabs Agency has designed reporting and dashboard systems for agencies and corporations since 2011. This starter kit is the same set of templates, style guide and training we use on client projects. Buy it for your reporting team, or ask us to build your reports with it.
Sale
An Introduction to Data Visualization and Storytelling Course
Original price was: $188.00.$130.00Current price is: $130.00.
Sale
Designing Great Dashboards Course
Original price was: $188.00.$130.00Current price is: $130.00.
Tell us about your reporting...
Data Analysis & Reporting
Tell us which report takes your team the longest, who reads it, and when it is due. We reply with the next step, usually a short conversation about your goals.