


What Is The Business Case for Infographics?
How You Prove The Value In Better Communication, Information Design & Reporting
Your business has data and information. And your business needs to communicate it. Whether that be to internal stakeholders, the media, your customers, members, or even to the general public. You need to be able to communicate effectively to a range of demographics.

Reaching Your Audiences and Reaching Your Business Goals
Maybe you want to release a snapshot of your organization’s progress over the last year to help gather more funding. Or maybe you want to explain your product or service and have it be memorable enough that prospective clients don’t get lost to your competition. Maybe you just want to add something memorable to your website for the same reason. How about that Annual General Meeting (AGM) presentation coming up? Will your investors be impressed … or underwhelmed. Is there a new HR process getting rolled out that your staff needs to understand? We could go on listing more reasons businesses need to communicate, but I’d really like to be home in time for dinner tonight.
The common denominator in all these scenarios is simple. The business is trying to achieve an outcome based on communications. Funding, conversions, streamlined staff procedures, and investor retention. These are all measurable indicators of your business’ bottom line. So if you really want to achieve these outcomes, it’s time to change things up a bit and address the varying needs of your audience. It’s time to actually engage them with your comms.
Marketing Hat On, Jazz Hands Ready
Yes, it’s inevitable that corporate business reports, presentations, and a lot of other communications content will be heavy on details and numbers. But it shouldn’t sacrifice engagement levels or a decent design.
Nobody wants to be bored with dull and complex statistics and information. And, keeping in mind the tiny attention span of people these days (now less than that of a goldfish, apparently), you really need to put your marketing hat on to get any message across. You need to ‘jazz it up’. Heard the saying, ‘a picture is worth a thousand words’?
By re-creating and re-organizing typically dry data into visually compelling formats, infographics take the “show, don’t tell” technique into a whole new level of modernized communication. And let me tell you, infographics aren’t just for the tweens on social media. Infographics mean business. Don’t believe me?
Here Are 12 Solid Reasons Why Infographics Should Be a Part of Your Business Communication Strategy:
1. Infographics stand out and attract your audience.
Presented with supporting graphics, the information within infographics is more noticeable and more compelling for your audience. Humans, after all, are visual creatures. People need the ‘optic nerve’ activated in order to process the information that floods into one’s mind, and more than 90% of that is visual information. Hence, infographics are likely to immediately attract and capture your audience’s attention. Try throwing the same information in report-form at your audience and see if they take it as well.

2. Infographics simplify and help your audience understand complex information
If you can’t explain it simply, you don’t understand it well enough.
– Albert Einstein
Written English (with a seemingly infinite number of word combinations) can be extremely dry, difficult to understand, and can easily confuse and disengage your readers – well before they get to the end of your report. Cut the guff and leverage imagery that holds meaning so your message becomes clear and intuitive, without your audience feeling like they’ve just read a Game of Thrones novel (no offense to those who really enjoyed reading about every single platter of food on the table at the King’s Feast – Hint: there was a lot). One of the main aims of infographics is to explain things simply. Combining interesting, relevant graphics with minimal, yet well-written text helps to avoid information overload while adding valuable context to the piece for quick understanding.

And so infographics become a very powerful tool. Suddenly, your audience can more easily digest your complex data and core messages. And the level of literacy required to comprehend it is drastically reduced, so your message also becomes more accessible to a range of demographics.
3. Infographics engage your audience for longer
You’ve got their attention and they’re understanding your message – so you’re on the right track. But what’s to stop your audience from deciding they’ve had enough before they even reach your ‘business punchline’? Remember that goldfish attention span we mentioned earlier? By nature, infographics are a lot more interesting to look at. The imagery throughout an infographic also helps to substitute and break up dense information. So there’s less text to read and there are more appealing graphics that add an element of entertainment sprinkled through. In short, your audience is far more likely to finish absorbing an infographic than your typical text and table reports.

4. Infographics leverage imagery to increase reader retention
The goal of infographics is to turn cluttered text and statistics into a clear, streamlined format. More than that, those ‘pretty pictures’ add context and affirmation to the information at hand and ultimately allow the reader to retain it for longer. How? With their informative and memorable visuals, infographics help your audience to firstly understand the information. Proper understanding alone helps to increase the longevity of its memory. Though the real contributors are those accompanying graphics. The brain can relate information to images and images to information (and likewise with smells and other senses). Therefore, there is a much higher chance of your audience being able to recall and retain the information – and retain it for longer.

5. Infographics can increase your brand awareness and even go viral
Infographics get noticed more easily, hold your audience’s attention, get retained for longer, and are highly shareable. Not to mention that if you design the infographic in your company branding, your business becomes more easily distinguishable. Design a really great infographic (with good content, of course), push it online, and there’s some very real potential for it to go viral. So if that infographic mentions or attributes your business, you’ve just increased your brand awareness – as well as credibility – in a really, really effective way. Go on, give yourself a pat on the back, and the afternoon off.

6. Infographics can increase your search marketing results
Search engines don’t just index pages, they also index images. Some people specifically search for images. There’s a basic increase there, but much more than this, infographics are great for sharing and embedding across social and other online platforms. Essentially, your infographic is being featured on other websites. And this generates a marketer’s dream: precious back-links to the source, aka your website. These inbound links allow you to build links, drive traffic to your site, and improve your site’s overall ranking for search engine visibility.
TIP: don’t forget to name the image file with effective keywords for SEO purposes. They’ll have a better chance of being found online (and for the right reasons, too) and therefore increase your traffic and views.

7. Infographics can build your social presence and increase your subscribers and followers
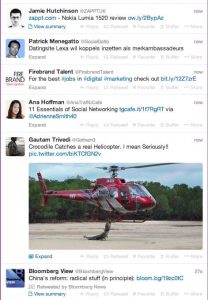 Well-designed infographics and interesting visuals will generate more engagements (likes, comments, shares) on social media platforms compared with any ordinary text updates. In fact, research from digital marketing experts highlight that ‘up to 37% increase in targeted customer engagement occurs because of social media posts that include visual elements such as photos, graphics, and infographics’. Similarly, sharing infographics on social platforms allows you to reach a broader audience and has the potential to turn that new audience into your new subscribers and followers. Even a simple image stands out in the crowd on Twitter. Imagine the impact of an interesting infographic.
8. Infographics aid the discovery of relationships and insights into data
By arranging and mapping data into visuals, infographics encourage stories and relationships between data to be surfaced. When you can physically see previously disjointed facts and figures in a simple and orderly visual, comparative analysis becomes much easier. Reports can present the facts – but a good infographic will present those same facts and imply other conclusions, simultaneously. So your data becomes a lot more meaningful.

9. Infographics can help you reach audiences who don’t speak your language
Images have no language and can be interpreted by any person who sees them. Infographics harness relevant images and diagrams to aid the explanation of information. Some infographics barely use any text and still effectively communicate key messages. Design your infographic well and you, too, can end up with a communications piece with no, or minimal, language barrier. And no language barrier paired with the awesome distribution powers of the Internet means your infographic has the potential to have a global reach.

10. Infographics expand far beyond digital marketing
Ok, ok – enough about online digital and social. While there are many online formats and platforms for an infographic, their reach and potential don’t stop there. Infographics can be used in print posters, brochures, educational material, corporate documents, disposable tray liners in a fast-food diner, even! Not to mention the digital, but offline formats such as PowerPoint presentations, PDF documents, and digitally packaged learning content. The same communication principals that infographics champion so well in the online realm are just as effective on paper. And if you have a particularly long piece of content, adding infographics here and there can be a great strategy for effectively summarizing chapter content, explaining more complex topics, and simply keeping your reader engaged.

11. Infographics can be tailored to target specific demographics with ease
It’s a basic principle of marketing – you need to know your audience. But, of course, there could be several demographics within your audience. That’s where infographics can really help, using their high versatility. Infographics can easily be tailored to deliver information effectively to your target audience. A simple change of imagery can help engage a different audience. And breaking down your infographic into formats that are optimized for different platforms will increase the chances of engaging different audiences across those platforms. Target marketing helps businesses save money in their marketing efforts as they can focus their marketing spends on the audience who are most likely to read or buy their information, products and services, rather than spending on a generic marketing piece with a generic aim.

12. The possibilities are virtually endless
Automation, reproduction and increased distribution are all possible once you create an infographic.
The mic drop
If you’re still not convinced that infographics are truly one of the most effective business communication tools, it’s likely because this is a 2,000-word article and not an infographic (ba doom chhhh). Though all jokes aside, infographics are powerful. Will other communication formats allows you to extend your audience, capture their attention? Will they hold their attention, allow them to understand complex information with ease, retain it for longer, engage them, entertain them. And will they increase your own brand awareness, reach and credibility and creating a consistent campaign for a bundled price on a range of formats?
Reflect on your current communications strategy. If it’s not working, I think you now know what will.

Infographic Examples
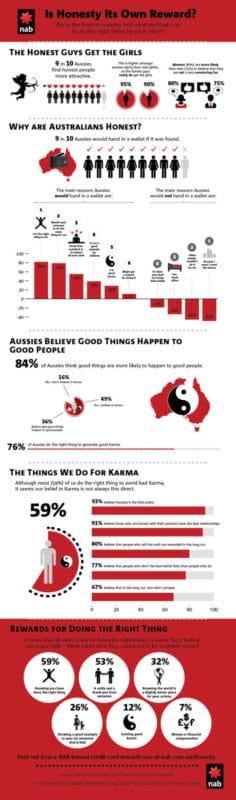
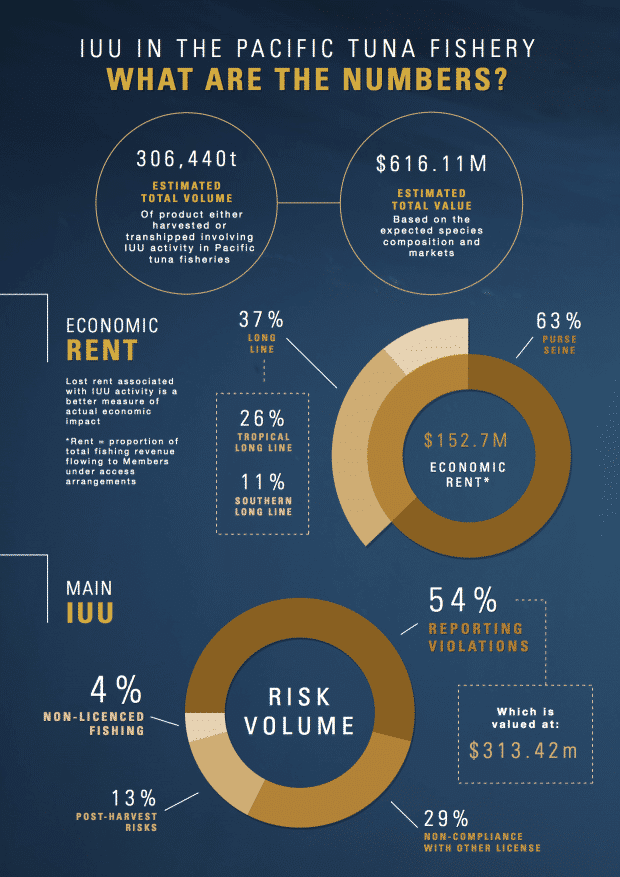

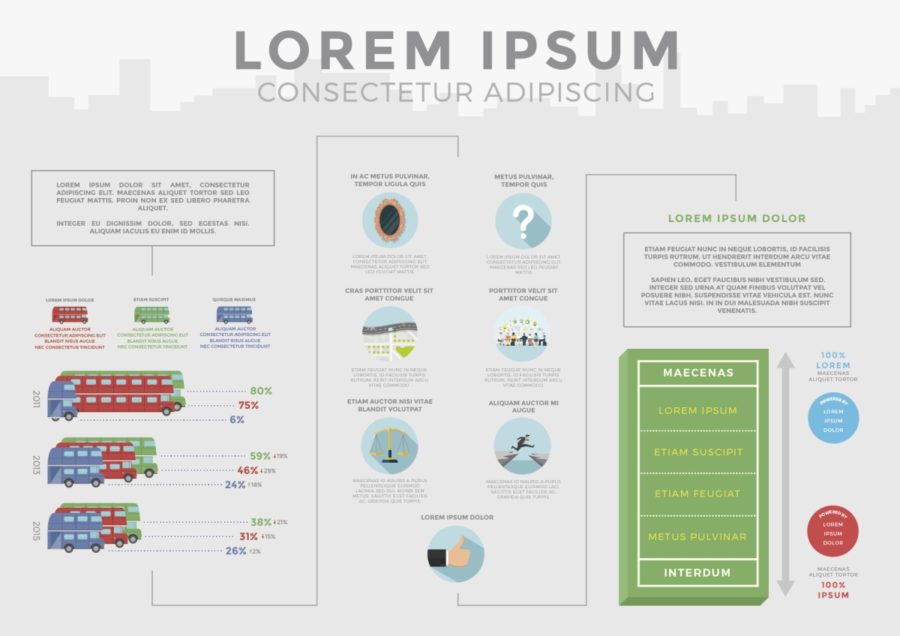
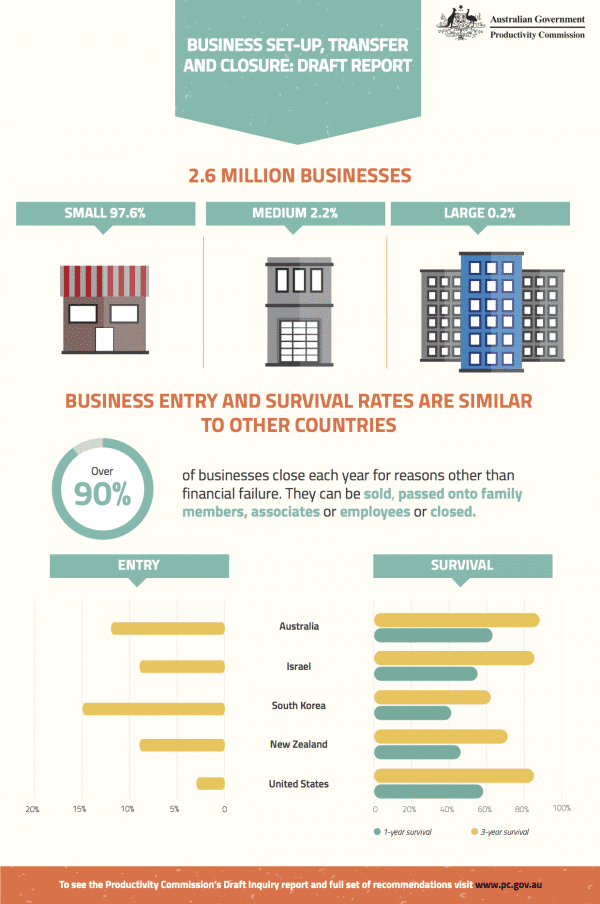
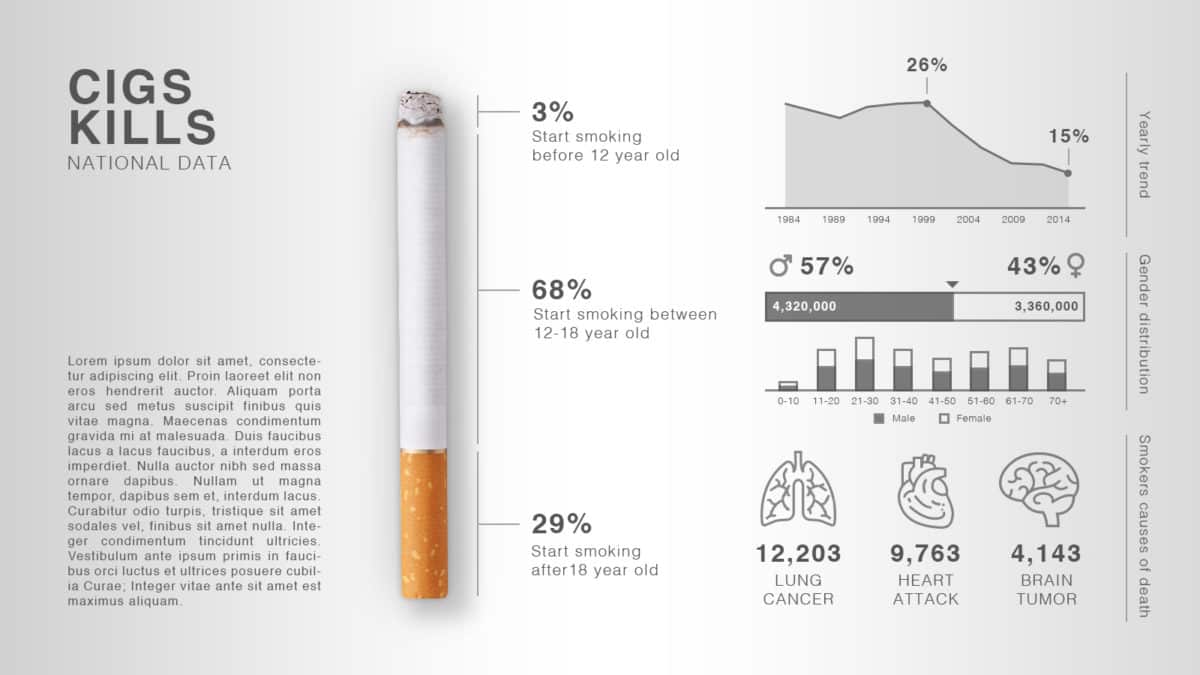
Long Infographic Report Example


Ready to communicate beautifully and effectively with an infographic?
Head straight to our inbox at hello@datalabsagency.com
or simply click Contact Us in our website navigation to access our online form.