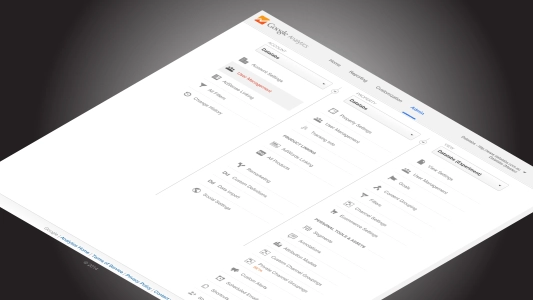
Google Analytics is a free, and powerful, tool that could vastly improve your digital campaigns.
The catch is, you’ve got to invest time and effort in learning how it can help.
As a Google Analytics Agency, we’ve seen too many clients’ campaigns suffer for lack of even basic analytics insights. The sheer quantity of data available in Google Analytics is a clear stumbling block for these clients.
Our advice for anyone starting out with Google Analytics is to begin with just a few key metrics. Even basic insights such as knowing what kind of content your audience likes can help make smarter decisions for your campaign.
Ultimately, the best way to manage analytics is with a tailored analytics plan that has considered your unique audience and products to develop a unique set of highly relevant metrics. But, you’ve got to walk before you can run, and we recommend starting with the simple ABC of metrics:
- Acquisition
- Behavior
- Conversion
These three metrics offer valuable insights for almost every digital campaign. When you see the difference that even these basic metrics can make to your campaign, you’ll be writing a detailed analytics plan in no time!
Google Analytics Metric #1
Acquisition
“Acquisition” is a technical term for how people find your website. In other words, did they click a link in a Facebook post, or arrive via a Google search?
The acquisition channels Google Analytics identifies are:
- Organic Search (Google, Yahoo! and Bing)
- Referral (a link from another website)
- Direct (someone types your domain name into their web browser)
- Social (Facebook, Twitter, Reddit, etc.)
- Paid Search (Google AdWords and other advertising platforms)
Google Analytics’ acquisition data is invaluable not just because it can tell you which platforms are bringing in visitors, but because it breaks down that data by Session Duration and Bounce Rate, meaning you can identify which platforms are bringing in the most engaged visitors.
For example, if Promoted Posts on Facebook are bringing in 200 visitors each week, but those visitors only stay on your site for a few seconds, it might be better to invest in your email newsletter, which could be bringing just 10 visitors each week, but who tend to stay longer and visit more pages.
Ultimately, acquisition analysis informs good decision-making about which platforms you should be investing in.
Google Analytics Metric #2
Behavior
Should your next piece of content be a 2,000-word article or a 30-second video? The answer depends entirely on your audience.
You can discover what content your audience likes best with the Behavior section in Google Analytics. There are a number of ways to segment the Behavior data. Begin by looking at the Overview, but don’t stop there!
You can find a detailed set of data on your most visited pages by opening the Full Report. The data in this report tells you a lot about your content. You can see which pieces are bringing visitors (Pageviews), which are keeping them engaged (Time on Page), and, crucially, which are leading visitors to look at the rest of your site (Bounce Rate and %Exit).
Your job, as an analyst, is to determine what the patterns in this data are. Perhaps 70% of the best performing posts start with “How To…”. Or maybe posts that feature hilarious images are outperforming text-heavy posts. Once you find these patterns, you’ll have a great insight into what kind of content you should be creating.
Google Analytics Metric #3
Conversions
Conversion metrics tell you which content is turning visits into measurable actions. These actions are measured by “Goals”, which you set, based on what is most relevant to your campaign. A goal might be a sale or a download of your app or a signup for your newsletter.
Once you’ve set your Goals, you can come back to Conversations to find out which pieces of content are best for getting your visitors to complete your goals.
Don’t be intimidated by all the jargon. Conversions offer the most direct insights into what’s working and what’s not and can be invaluable in determining the right strategy for your campaign.
It’s that easy?
Believe it or not, that is all you really need to know to get started with Google Analytics. The simple ABC metrics will help you find, track, and measure what’s working and what’s not. With that information, you can make better decisions for your campaign. Managing your own Google Analytics is probably much easier, and more valuable than you ever considered.


