

4 Marketing Analytics Trends That Will Kill It In 2016
As digital marketing continues to evolve and marketers gear up for 2016, here are the 4 analytics trends that we think will push your campaigns from good to great this year. As digital marketers embrace analytics techniques, Deloitte Analytics predicts that it will prove to be an intelligent move in business decision-making.
The Deloitte Analytics trend report 2015 declares that “analytics is becoming both the air that we breathe—and the ocean in which we swim”. These 4 analytics trends evolve and drive marketing analytics forward in 2016.
 Predictive Analytics
Old school, interruptive marketing is giving way to subtle, contemporary digital techniques (inbound marketing, content marketing) that optimize marketing and drive strategic business decisions through intelligence based on data.
Increasingly, consumers’ decisions are driven by their access and use of technology. Customers’ preferences generate huge amounts of data that can be leveraged and analyzed to ask and answer questions about future behavior.
Predictive analytics can then interpret, analyze, and act on the data, independent of human input. Predictive analytics fleshes out the data gathered from the customers’ preferences and predicts customers’ behavior and buying patterns.
It is “not merely about predicting what we want. It’s more like anticipating”, says Daniel Kehrer, VP Marketing, MarketShare.
Content Marketing Analytics
The last few years have seen content marketing become an integral part of most business’ marketing strategy. A persuasive marketing strategy leverages worthy content across platforms to connect with its customers.
“The theme of 2016 for content marketers will be amplification and personalization”, says Jason Miller, Content Marketing and Social Media Manager, LinkedIn Marketing Solutions. That targeting needs good quality, fast-acting analytics to be able to quickly measure and test how content resonates with customers.
The content marketer needs to focus on generating content that engages and educates the customer within its narrative, which in turn will resonate with the target market and be shared. In 2016, marketers must work towards creating strategies to harness the power of content marketing and the data it provides.
Content marketing analytics provides the metrics not only to assess the effectiveness of the content but also to understand customer intent. If used well, these analytics assist in making informed business decisions that build the sales funnel, delight your customers and open up markets and opportunities that will drive your business forward in 2016.
 Real Time Analytics
With tools such as Facebook IQ, the digital marketing world today is more accepting of ubiquitous data collected in real-time.
Ramin Sayar, CEO SumoLogic, identifies that real-time analytics is of essence for business sustenance in 2016, “by harnessing the insights inherent in real-time log data analytics, companies will have faster access to operational and customer data that can enable 24/7 innovation and sustain their competitive edge”. Real-time analytics can individualise the process of generating personalized content, pricing and solution targeting.
Even though there is still conjecture about what classifies real-time, the simple chance to interpret real-time analytics offers marketers with intelligence to back marketing campaigns. Marketers agree that real-time data can initiate campaigns with instant access to the customers’ activities, such as purchases, website activity or events updates.
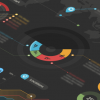
 Data Visualisation and Analytics
We think more marketers will agree that the use of data is still in its infancy but the possibilities are becoming more and more clear.
Marketers are beginning to use analytics and find insights that open new and highly targeted marketing communication channels, making content connect with. Visual analytics significantly augments the representation of massive digital data.
In 2016, visualization of content goes beyond a two-dimensional representation and transforms information with data design, interactivity and dashboards. Miranda Miller, Chief Content Strategist at MEDIAau.com observes, “mini-graphics, photos, illustrations and other types of visuals give you a chance to trigger an emotional reaction. You can inject humor, or highlight important points – images are incredibly versatile and they’re most useful not in place of text, but when used to complement tight, compelling copy”.
Using visual analytics provides intelligence to understand, alter, and interpret the key trends and identify sectors that demand attention. In the visualization process, marketers have to opportunity to convey large and complex data sets with clarity and simplicity, leading to faster understanding and decision-making.
With access to data, the tools to process and visualize it switched on marketers have the opportunity to measure engagement, intent and insight at a volume and speed that creates real competitive advantage 2016.
Of these trends, which do you think will continue to add value to digital marketers and their practices in 2016?
Feel free to comment on our Facebook, Linkedin, or Twitter.