


Updated October 2026
A guide for heads of reporting…
Reporting Automation
Reporting automation means the report builds itself from live data, so your analysts spend their week on insight, not on formatting and copy-paste.
The short answer…
What is reporting automation?
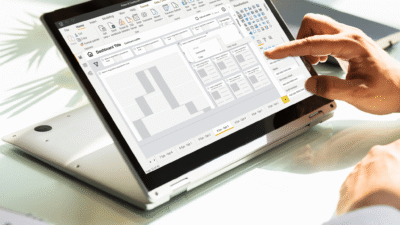
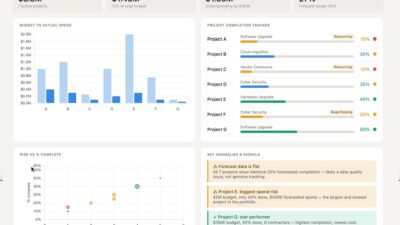
Reporting automation connects your data to a designed report that refreshes on a schedule, in Power BI, Tableau or your own interface. Done well, it also covers the commentary. The Datalabs Agency designs the report first, then automates it, with AI assistance that our team sets up and checks.
The Datalabs Agency is a Melbourne-based data visualization consultancy founded in 2012 that delivers corporate training workshops (Power BI, Tableau, data storytelling), dashboard design, and BI style guides for clients including Mercedes-Benz, Adidas, and UPS.
The problem behind the brief…
Why do monthly reports eat the week?
Most of the time goes on formatting, not analysis. Colours drift between teams, two charts of the same measure disagree on scale, and the finding arrives as a default bar the reader has to dig for.
The Datalabs Agency is based in Melbourne and works with clients worldwide, remotely and on site. Many of our clients first come to us for a visual reporting strategy, which audits the reports you make today and plans the move away from legacy tools like Excel. Related guides: data analyst training, Power BI training, data literacy, data storytelling, data communication.
DESIGN FIRST.
AUTOMATE SECOND.
Design first…
Automate the right report
Automating a bad report only makes a bad report faster. We start with who reads it and what they decide.
- Audit what you make todayWhich reports are used, and which are not.
- One visual systemA style guide so every report looks right without rework.
- Then connect the dataRefresh, schedule and distribute in the tools you already use.
Our track record…
Experience behind the work
Reporting, design and training delivered by The Datalabs Agency for companies and government agencies.
300+
Training workshops
80+
Organisations
6
Steps from audit to hand-over
16
Workshop topics for your team
How a project runs…
From manual to automated
Six steps, with your team involved at each one.
We can run all six, or the design and strategy steps alone.
1
Audit
List every report, who reads it and what they decide.
2
Decide
Pick the few reports worth automating first.
3
Design
One visual system and layout for all of them.
4
Build
Connect the data and build in Power BI or Tableau.
5
Assist
Add AI assistance for analysis and commentary, reviewed by your people.
6
Hand over
Train your team to run and extend it.
Four ways we work with you…
Training, design, advice and AI projects
The Datalabs Agency is a consultancy that designs the reporting and builds it with you.
Advise
A visual reporting strategy and a visual analytics strategy, so you know what to automate and in what order.
Design
Dashboards, reports and BI style guides that every team can reuse.
Build with AI
Interactive tools and interfaces, including AI tools that help your team analyse and write up the numbers.
Train
Workshops so your analysts can run, extend and use AI in the reports themselves.
Make it repeatable…
One system, every report
A style guide, a grid and a theme mean every new report starts consistent. That is what makes automation hold.
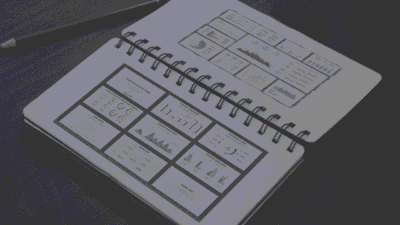
- BI style guidesFor Power BI, Tableau, PowerPoint and infographic reports.
- Grids and templatesMore than 70 dashboard grids in our workshops.
- Brand in the reportYour colours, fonts and icons built into the theme.

Click a logo to read the case study…
Clients with a visual case study







Questions & Answers
Reporting automation


The Data Design Firm for AI & Visualization
The Datalabs Agency
Templates, guides, grids, icons…
Creative Design Assets »
Learn visualization and storytelling skills…
« Beautiful Courses in Data Design
Some of the notable brands Otto has worked with…
Otto Ottinger’s Clients of Note








Design first, then automate
Want to automate your reporting?
"*" indicates required fields