


Formalize your company’s approach to reporting through infographic reports, motion graphics, animated data videos, interactive data visualization, digital imagery and printable reports.
Team training workshop
Report data insights beautifully and intuitively.
Visual Reporting Strategies
The short answer…
What is a visual reporting strategy?
A formal plan for how your organization reports its data: the formats, the visual style and the tools.
What it covers…
Formats and tools
Infographic reports, dashboards, motion graphics, animated data videos, interactive data visualization and printable reports.
Ideas...
What this strategy can hold
Click a circle to see the idea in practice.
Each idea is a service we deliver. Ask which one fits your organization.

Who needs one...
Who Needs a Visual Reporting Strategy?
Companies and government departments that produce many reports, or are going through transformation.
Organizations whose stakeholders have stopped using the official reports.
What problems it solves...
Reports that nobody uses
Many reports are repetitive, flat, dense and ugly. Key stakeholders bypass them for better data, or for a person who can answer their questions.
A visual reporting strategy fixes that engagement problem. It also points to the interactive dashboards, infographic reports and PowerPoint templates that get everyone into the data.
What it makes possible...
Insight at executive speed
Teams see a visual system of insights. Executives act on accurate data, seize opportunities and reduce risks.
Retrofit your reports for a new generation: move away from Excel, make them interactive, and keep them simple.
What is in the strategy...
What you get
Data visualization style guides for Microsoft Excel, and for dashboards in Tableau or Power BI.
A visual strategy pack that audits your existing reports and plans the move from legacy tools like Excel to interactive ones.
Time with a senior consultant, skilled in data design, user experience and visual storytelling.


Who does the work...
A team shaped to your organization
Data visualizers, project managers, business intelligence developers and visual strategists.
Designers and project managers run every engagement, so what reaches your executives has been checked by people.
From data systems to the plan...
How the strategy shapes your reporting
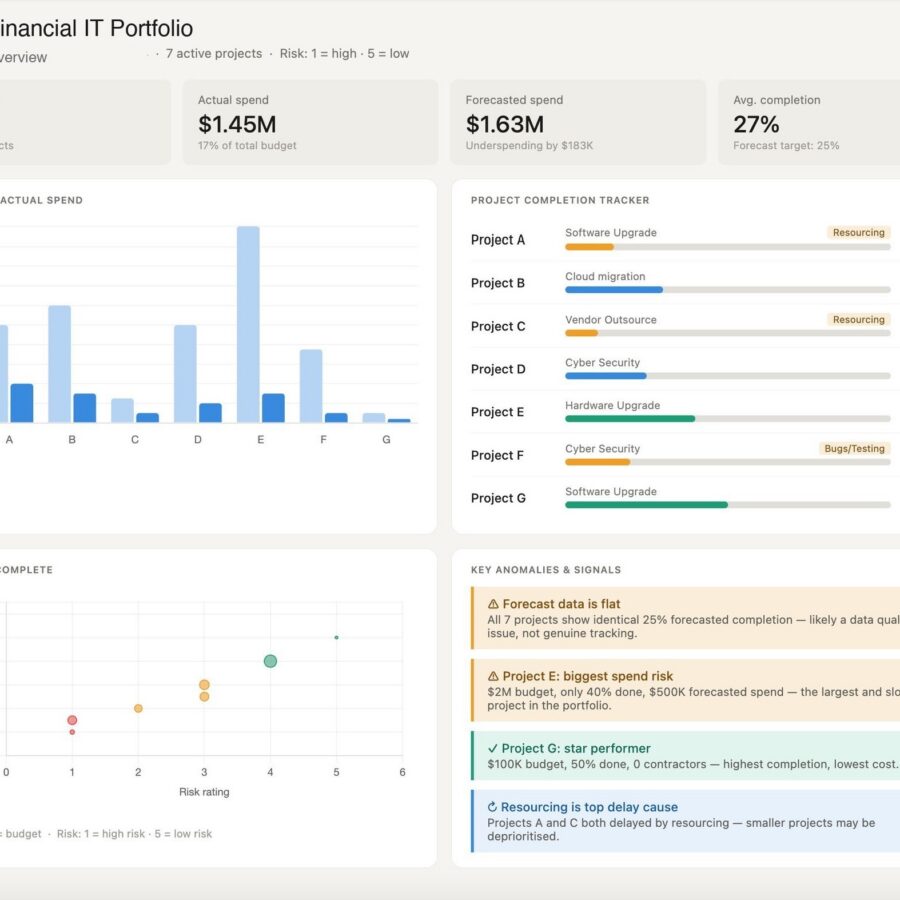
Each step moves your reporting closer to decisions: the reports you publish, the style they share, the dashboards that replace them and the insight leaders act on.
Your reports

Style guides

Dashboards

Decisions

A visual case study...
ZIM: One Method, Four Time Zones
ZIM Integrated Shipping Services, the Israeli global container line, wanted its analysts telling better data stories. The Datalabs Agency ran a lecture-and-workshop program across Israel, Hong Kong and the Americas, live from Melbourne.

Who creates all of our data strategies?
Otto Ottinger
Otto Ottinger is the founder and Managing Director of The Datalabs Agency. He designs visual strategies that connect a company’s data to the people who act on it: which formats to publish, how dashboards and reports should look, and how the data systems behind them should be mapped. He started as an editor and interactive designer at National Geographic and has since designed visual analytics, reporting and communication systems for clients including Mercedes-Benz, BlackRock, Adidas, eBay and Marriott.
250+ workshops · Government and corporate teams
Datalabs Agency is a Melbourne-based data visualization consultancy founded in 2012 that delivers corporate training workshops (Power BI, Tableau, data storytelling), dashboard design, and BI style guides for clients including Mercedes-Benz, Adidas, and UPS.
Questions & Answers
Visual reporting strategies
Book your team...
Visual Reporting Strategy
Tell us your organization, your team size and the reports you publish. We reply with a plan and a fixed price.