


What is a microsite & what are they used for?
A look at what makes a good microsite, how they differ to a website & some great examples.
In previous blogs, we’ve written about great digital data visualization experiences & digital annual reports; largely in the form of microsites. Today, we thought we’d go back to basics and explain a little about what a microsite is to us, and how we think they should be used.
According to Wikipedia, a microsite is “microsite is an individual web page or a small cluster of pages which are meant to function as a discrete entity[within an existing website
They entered our data visualization world through customers, via the digitization of their annual reports. Often used as a complementary version to go with the print version. More recently, some have been accompanied by a short, printable summary, other microsites have even replaced the need for a printed report.
For others, they became project pages, campaign pages, sub-brands pages, separate reports, or housing for design projects. Check out Time Magazine’s data viz link, for an example of a separate project page
Check out the Time Magazine’s data viz Labs page to see how a series of microsites are hosted within a larger website.
 Why do you need a microsite?
Marketing, branding, PR, interest generation, community outreach, and finally, simply making your project generally more awesome. We really like microsites because they tend to be born out of creativity, or the need to separate the project, design or idea from the parent brand or site, and allow it to find its own space.
 Specific examples?
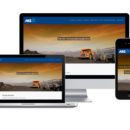
Sustainable reporting – this is one Datalabs made for a client last in 2015. It was in addition to their annual report, focusing on the sustainability of the business and it made sense to do away with print and go digital for the end product, what with saving the trees from an extended print run and al.
Research Delivery – Commission a report, gather some great data, see a story worth telling, publish reports and…nothing. We love the idea of taking your awesome research out of the tables and pdf’s and into something interactive, exciting and useful.
Something Useful (and in this case, offensive) – is basically an idea generator with swearing. The novelty has yet to wear off one me, but also pretty handy when you’re stuck for dinner ideas…
Large data sets & projects
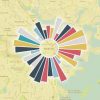
If you’re struggling to explain or even comprehend large datasets then the interactive design is an amazing way to let the user explore. Setting up a dedicated microsite allows you to focus on the purpose of that project. You can create housing and experience that allows the user to focus entirely on the data.
Check out this timeline visualization significant historical events from Wikipedia
That’s a pretty disparate mix of styles, formats, so now you should have a better idea of the range of amazing things that microsites can do.
If you like this one, have a look at the other microsites we build, some great examples of annual reports & some great web experience design.
Want to talk to us about your own microsite or UX design?
Get in touch with us directly by emailing hello@datalabsagency.com
or by clicking the Contact Us link in the navigation.