


The Data Visualization Format of the Year: The Interactive Calculator
A Great Example to Show You How It’s Done
This year has seen some great data visualizations. From interactive maps, virtual reality interfaces, and incredibly effective business intelligence dashboards – there’s a lot out there. And as technology keeps advancing, we keep increasing our expectations. So when it came time for us to choose this year’s winner of the best data visualization format, we must admit: it was a tough one. But without further ado – we give you the 2016 winner …
The Interactive Calculator
While there’s plenty out there, and there has been for quite some years now, interactive calculators bring new advancements to the table that make them far more helpful and insightful as well as much better looking (thankfully, we’ve moved past the age of clunky designs with gradients on every element).
 Take this calculator for example: The ‘Is It Better to Buy or Rent’ calculator published on The New York Times website. The title itself already tells you the potential value this calculator has. It’s the age-old question that everyone has asked themselves. And alas, they nailed it. Here’s why:
Addressing the Needs of a Complex Data Set
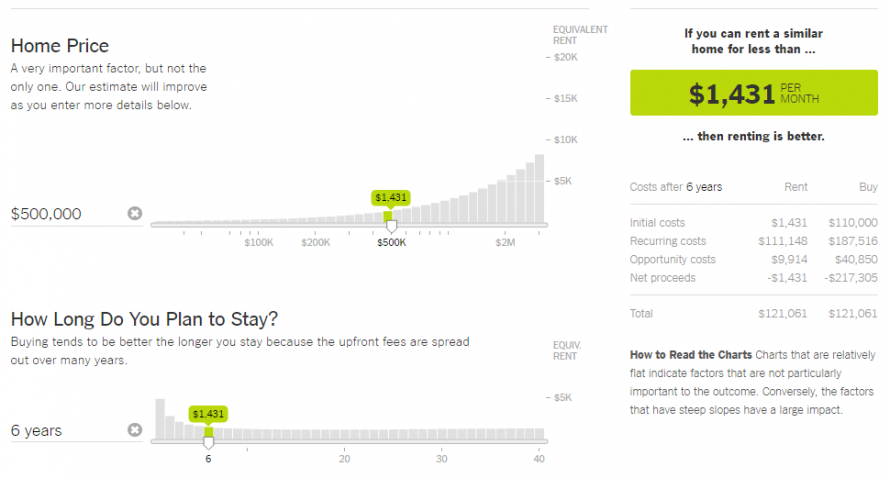
Firstly, there’s a lot to consider in the question of ‘to rent or to buy?’. This calculator acknowledges and addresses that perfectly with no less than 21 different financial factors displayed in interactive charts for the user to adjust based on their own unique position. One of the major keys to any data visualization is solid data. And this calculator captures it all to ensure a truly insightful result.
Making Great Design Decisions to Leave the User with an Awesome Experience
Next, we simply couldn’t look past the incredible user interface (UI) and user experience (UX), which really helped lift the interactive calculator format to the top of our list – and this is for several reasons.
-
- The design is clutter-free, making good use of just two colors and effective spacing. This is especially important for complex data visualizations as it gives a sense of simplicity in what could easily become an overwhelming and difficult experience for the user.
-
 The results are instantaneous based on every adjustment the user makes. Aside from it looking super cool as the charts and figures seamlessly adjust in synchronization across the page, this interactivity allows the user to see the effect that every factor makes on their decision. It’s incredible engagement and insight all wrapped into one. Nice!
-
- Modern, flat design is used on all elements – except for the slider elements, which can be interacted with, and stand out with clear outlines and cursor hover over effects. This makes for an easily distinguishable interface – even for those few people living under a rock that have never used a slider before!
-
- The final outcome is always visible. The calculator uses all its metrics to produce an important figure: the monthly cost of buying (so the user knows that, if they can rent a similar place cheaper than that, they’re better off). This all-encompassing value is neatly displayed with a few supporting secondary figures in its own panel to the right of the calculator. And, as the user scrolls through the various sliders in the calculator, the panel sticks with them in a constant position, allowing the user to intuitively glance there whenever needed. In addition, each of the individual sliders within the calculator includes this overall value highlighted in green.
- The calculator is completely mobile friendly! All these attributes still manage to work well and look fantastic on devices with screen widths as small as 250px (to put that into perspective, the iPhone 6/7 screen width is 375px). The functionality will even remain untarnished on devices with screen widths smaller than that. However, its good looks begin to fade, and text-legibility drops. But we’re certainly not complaining!
Breaking down complex data to simplify ideas
Touching back on the content itself, the calculator is a great example of how logical order and categorization of data can be used to simplify complex ideas. The simplest questions are asked first – the price of the home and intended length of stay – followed by the more tricky questions like mortgage, tax, and fee details, each of which is cleverly grouped together to guide the user through the data one topic at a time.
Keeping it simple without leaving out what’s important
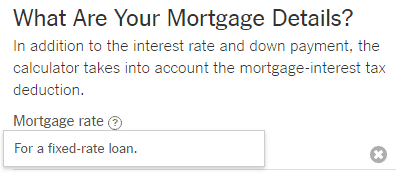 And finally, the calculator uses text – but only where needed. This is a tricky subject matter, so the user needs to understand the different factors, what they mean, and how it all ties in with their decision. The page starts with a short introductory paragraph and gives a sentence or two of explanation for each category of data sets. Additional information is available in hover-over tooltips where needed and more thorough explanations of the calculator’s methodology, along with definitions of some of the financial terms used throughout are displayed out of the way at the bottom of the page – so only those who are searching for the extra info have to see it.
All in all, this is a fantastic example of an interactive calculator … And reason enough for us to declare this data visualization format as the best!
Inspired by interactive data visualization?
Get in touch with us directly by emailing hello@datalabsagency.com
or by clicking the Contact Us link in the navigation.
Want to keep looking? Find out about Interactive Data Visualizations here.