

The Art of Photography and The Science of Data Visualization
In design, it is always good to be visual.
“Our brain processes images 60,000 times faster than reading text.” – Mike Parkinson
Photography is indeed a universal language accepted and understood by a wide range of audiences regardless of age and background. Even if the content is text-heavy, the addition of photography elements will keep the viewers’ interest and goad them to read further. To maximize the use of images in your design, there are tips and tricks that you should follow. Interested to know more? Continue on reading…
Treating Photos as Content
Photos are content. Be it a webpage, data visualization design, a presentation, or whatever else it is, photos should be treated as part of the content as it is as important as the text. A photo is worth a thousand words, they say, and it is indeed true since it can communicate and portray so much more than the text itself. Before deciding on what photos to include, certain questions need to be asked.
- Is the photo there just to “jazz up” an empty space? If yes…
- Does the photo contribute any further information to the content? Is it thought-provoking, helpful, and useful to the user?
- Can it stand by itself and still hold meaning?
Choosing the Perfect Photo
1. Be authentic
Recently, the internet has shifted towards using imagery that is more authentic and realistic, generally showing more diversity. Instead of using “stock” like images, people prefer seeing real-life situations, as it is more relatable. What are the key criteria in picking better images?
- Avoid stock photos as much as possible.
- Go with the most candid/natural images or images that show more character rather than the standard beauty.
2. Types of images
Depending on the theme of the content, selecting appropriate images is crucial. There are several types of images you can use:
- Thematic images: Photos that support the theme.
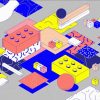
- Abstract images: Photos that show no particular object/subject; generally with abstract lines, curves, and shapes that evoke a certain mood/feel.
- Real-life images: Often candid photos that show movement and life without being edited photoshop.
- Illustrating concepts: Photos that might not directly be related to the subject matter, but portray it in a symbolic/metaphorical way.
- Humorous images: Photos that captivates viewers’ interest because it is funny.
- Evocative images: Photos with powerful imagery that tells a visual story and evokes strong emotions amongst viewers.
It’s hard to put different types of images in clean categories. Above are just some examples to get your thinking caps on when trying to come up with ideas. Various types of images could work well within your design, it’s just a matter of which is best to deliver the concept and message you are trying to convey!
3. Full-screen vs partial-bleed images
When considering the placement of photos, it is important to look at the chosen image and see what works best in terms of the design.
- Full-screen images: Sometimes images can look good acting as a background. This is called “full-bleed”. Be it for a website, slide deck, or data viz design, using an image as background can be more impactful than just placing it on a smaller scale next to the text.
- Partial-bleed images: With that being said, that doesn’t mean smaller images won’t work well. Sometimes an image is better off placed on one side of the design. This is called “partial-bleed”. The text then can be placed on the blank space, creating a clean-looking design.
4. Image quality
This is a fundamental aspect of choosing photos that you always need to abide by. Good quality photos should be crisp, clear, with a high resolution. Don’t distort images by stretching them — make sure to lock in the aspect ratio when adjusting an image’s size.
5. Pay attention to cropping
Cropping could be a powerful technique in making your images more impactful. A typical mediocre image can be transformed by cropping so that the subject of interest becomes the focus.
____________________
Including the right visual elements is crucial in creating good design. If you’ve enjoyed this, make sure to check out our previous Data Design Principles posts, covering Color and Hierarchy.