Charts and Graphs, Formats and Tools
Which Type of Data Visualization Are You Interested in Learning About?
In this article, let’s look at the different types of data visualization.
What charts are out there in the world? What formats are used in modern data visualization? What types of tools and software do you use for data visualization?
I wanted to know the answer when I started designing data. And this industry is always changing, year after year. So we’ve refreshed our view on the different chart types we think you should know about. We’ve expanded into the different formats data visualization is viewed and experienced. And finally, if you’re interested in “how-to” visualize data, click on the button below to peek inside the types of data visualization tools you want to be aware of in 2022.
So which type of data visualization are you curious about today?
Types of Data Visualization Charts and Graphs
With the growing amount and accessibility of data, knowledge about the types of data visualization is becoming increasingly important. According to the writers of A Tour Through the Visualization Zoo, “The goal of visualization is to aid our understanding of data by leveraging the human visual system’s highly-tuned ability to see patterns, spot trends, and identify outliers.”
In general, there are two different types of data visualization: exploration, which helps find a story the data is telling you, and an explanation, which tells a story to an audience. Both types of data visualization must take into account the audience’s expectations. Within these two basic categories, there are many different ways data can be made visual. In this article, we’ll go through the 15 most common types of data visualization that fall under the 2D area, temporal, multidimensional, hierarchical, and network categories.
Multidimensional Chart Types

Pie chart
Histogram

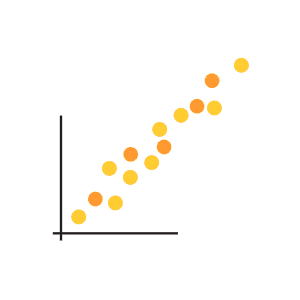
Scatter Plot
Temporal Visualizations

Connected Scatter Plot
Polar Area Diagram

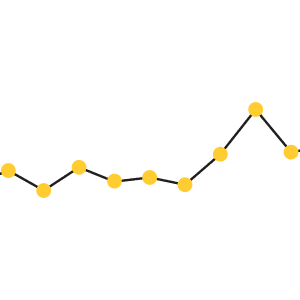
Time Series
2D Area Visualizations

Cartogram
Choropleth

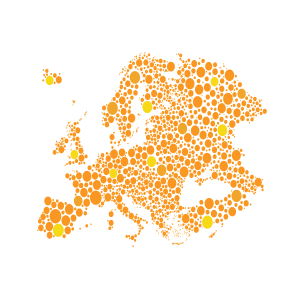
Dot Distribution Map
Hierarchical Charts

Dendogram
Ring Chart


Tree Diagram
Network Visualizations

Alluvial Diagram
Node-Link Diagram


Matrix Chart
Types of Data Visualization Formats
Here we’ll look at the top 5 formats there are in data visualization. Number 6 will eventually become holograms. But until that day comes, let’s stay realistic and look at 5 of the most common format types: infographic reports, digital dashboards, data presentations, interactive data visualizations, and animated data videos.




Flat, Interactive, & Motion Formats

Infographic Report
Dashboard


Data Presentation
Interactive Data Visualization


Animated Data Videos
Types of Data Visualization Tools
There’s a glut of data visualization tools out in the market today. But really we at the Datalabs Agency use these five (and we code when we’re designing an interactive experience). So if you’re interested in learning about data visualization tools, you couldn’t go wrong with discovering more about Adobe Illustrator & After Effects, Tableau, Microsoft’s Power BI, PowerPoint, and yes, the ubiquitous Excel.



Types of Tools and Software for Data Visualization

Tableau
Adobe Illustrator


Power BI
Microsoft Excel & PowerPoint


Adobe After Effects
About This List of the Different Data Visualization Types
When and where data visualization evolves, so will our visual compendium of data visualization types.
This is our data visualization agency’s view of the different types of data visualization charts, formats, and tools. Obviously, the list could be near-infinite. So just like the universe, we’ll be expanding it.
From the dreaded pie chart to the often-misunderstood Sankey diagram, we’ll geek out on more data viz guidance, placing even newer content to this list of categories and types.
So bookmark this page and sign up for our data visualization newsletter to keep your data design brain well-fed.


