hello@datalabsagency.com
logo
Datalabs Agency
En
  • De
  • Ar
1
logo
  • Data Training
    • Our Six Main Workshops
      • Introduction to Data Visualization: Tools & Techniques Workshop
      • Designing Great Business Dashboards Workshop
      • Infographics & Report Design Workshop
      • Creative Data Presentations with PowerPoint
      • Visual Storytelling for Government Workshop
      • Creative Power BI Dashboard Design
    • Online Courses
      • An Introduction to Data Visualization & Storytelling
      • Designing Great Dashboards
  • Data Design
    • Style Guides
      • Power BI Style Guides
      • Tableau Style Guides
    • Animated Data Videos
    • Maps & Cartography
    • Interactive Infographics
    • Power BI Dashboards Designs
    • Tableau Dashboards Designs
    • Infographic Reports
    • Interactive Data Visualizations
    • Digital Annual Reports & Microsites
  • Case Studies
  • Shop
    • Ecommerce Products
      • Power BI Templates
      • Power BI Theme and Style Guide
      • An Introduction to Data Visualization and Storytelling Course
      • Designing Great Dashboards Course
      • Data Visualization Consultant
  • Login
  • Contact
    • About
      • Otto Ottinger
      • Blog
Visual Financial Modelling and Systems Visualisations Infographic 0
Visual Financial Modelling & Systems Visualisations
02 August 2014
Sales Reports and Business Dashboards Image 0
Sales Reports & Dashboards
02 August 2014
Communications
Annual General Meetings & Annual Reports
August 2, 2014 by Datalabs in Communications

Annual Reports General Meetings Data Presentations Infographic

Corporate Communications Problem

A lot of time, effort, and money go into producing corporate communications collateral like annual reports and annual general meeting presentations for analysts and shareholders. The problem is corporate report has evolved and companies are still communicating to their audiences in legacy formats. Talk to the public and company stakeholders in a modern way, tell them an engaging story, and use data and data visualization to do it.

Data Visualization Idea

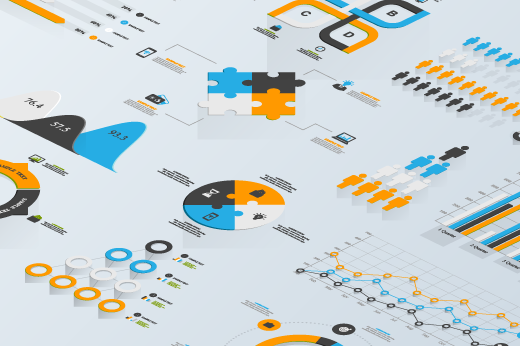
Corporate annual reports and annual general meeting presentations are often data-heavy communications. Excite your audience with a creative execution that pulls in a larger audience, leverage the public relations (PR) value of these events to communicate the financial insights, environmental sustainability metrics, and community engagement numbers — the good news stories. Give your Chief Executive Officer (CEO) a beautiful data presentation or animated data video, allow him or her to effectively communicate financial data, corporate processes, or announce a major event, visually and simply. Modern companies need modern communications tools and that’s what Datalabs designs.

Printed annual reports might still be necessary. However, that doesn’t mean that they’re effective communications collateral. If you had to design them again today, with today’s innovations and creativity, what would you do this year with that report? The Datalabs Agency thinks the annual reports is digital, interactive, and animated. We’ve got two products that’ll lift your corporate communications profile: the Animated Data Video and the Data Presentation.

Implementation

Datalabs fits neatly into any company corporate communications plan. We work well with other agencies, copywriters, and designers. Data visualization, analytics, and visual reporting are what we’re known for. Your communications team is the lead: you know your audience, your stakeholders, and the story you want to tell and who you want to tell it to. We’ll work on your brief, visualizing report data, designing the interactivity and the animation, keeping corporate style guides and branding in mind throughout the process. We think our visual reporting innovations will get the message out more broadly and in a way, your audience will recall greater than the old printed annual report and stale PowerPoint. Connect with us today and see what we can do for your corporate communications report or event.

Products and Services Used in this Data Visualisation Idea

Data Analysis, Animated Data Videos, Data Presentations

0 Comments
  • animation
  • corporate communications
  • events
  • video
  • visual reports
0 Like!
Share
Datalabs

Data Visualization Training: Workshops & Courses

Shop Online for Data Visualization

  • Image of a man using our Power BI templates to design a report
    Power BI Templates
    Select options
  • Image of our custom Power BI Theme on a computer
    Power BI Theme and Style Guide
    Select options
  • An Introduction to Data Visualization and Storytelling Course
    An Introduction to Data Visualization and Storytelling Course
    Add to cart
  • Photo of a data visualization consultant advising clients and helping solve design issues.
    Data Visualization Consultant
    Buy product
  • Designing Great Dashboards Course
    Designing Great Dashboards Course
    Add to cart

Style Guides for Data?

A photo of our data viz style guide for Microsoft Power BI

Data Visualization & Storytelling Group Workshops

Contact Us

  • This field is for validation purposes and should be left unchanged.

From Our Blog

  • 8 Incredible Examples of Interactive Data Visualization
  • Data Analytics Conferences 2024 & 2025
  • Data Visualization & Design Conferences 2024 & 2025
  • Case-study: Intranet Dashboard Design for Nestlé
  • Dashboard Tips: 3 Alternatives To Using A Data Table
  • Data Visualization Training
  • Brand Guidelines for Data
  • Online Courses & Products
© 2024 Data Arts Pty Ltd
logo

We noticed you're visiting from Australia. We've updated our prices to Australian dollar for your shopping convenience. Use United States (US) dollar instead. Dismiss