hello@datalabsagency.com
logo
Datalabs Agency
En
  • De
  • Ar
0
logo
  • Data Training
    • Our Six Main Workshops
      • Introduction to Data Visualization: Tools & Techniques Workshop
      • Designing Great Business Dashboards Workshop
      • Infographics & Report Design Workshop
      • Creative Data Presentations with PowerPoint
      • Visual Storytelling for Government Workshop
      • Creative Power BI Dashboard Design
    • Online Courses
      • An Introduction to Data Visualization & Storytelling
      • Designing Great Dashboards
  • Data Design
    • Style Guides
      • Power BI Style Guides
      • Tableau Style Guides
    • Animated Data Videos
    • Maps & Cartography
    • Interactive Infographics
    • Power BI Dashboards Designs
    • Tableau Dashboards Designs
    • Infographic Reports
    • Interactive Data Visualizations
    • Digital Annual Reports & Microsites
  • Case Studies
  • Shop
    • Ecommerce Products
      • Power BI Templates
      • Power BI Theme and Style Guide
      • An Introduction to Data Visualization and Storytelling Course
      • Designing Great Dashboards Course
      • Data Visualization Consultant
  • Login
  • Contact
    • About
      • Otto Ottinger
      • Blog
Jobs Digital Sales Assistant Infographic Image 0
Content Marketing & Project Assistant
18 August 2017
Data Map Victoria 0
Three Interactive Maps
26 October 2017
Articles
SEEK Laws of Attraction
September 14, 2017 by Datalabs in Articles

Interactive Microsite

SEEK Laws of Attraction

Find out what Australian candidates really want

What attracts people to apply for a job or work for a company has changed. Where salary and job security once ruled, candidates are now seeking more. 

For example, did you know that 72% of candidates working in Information & Communication Technology would like to have the option to work from home? Or that the number one driver for science and technology candidates is career progression?

To uncover what Australians really want, SEEK asked nearly 6,000 Australian candidates what they’re looking for in their next role. From up-close, it’s difficult to identify what attracts people to employers. But in taking a step back and looking at the whole picture, the data trends tell a story. And that’s exactly why Laws of Attraction was created.

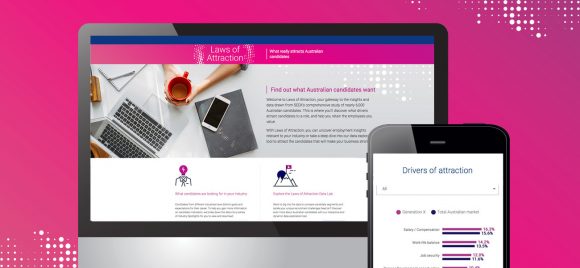
The data from SEEK’s comprehensive study was analyzed to design an interactive microsite where you can discover what attracts a candidate to a business. With the click of a button, employers can explore what candidates in their industry really want.

Understanding the forces that attract people to a role and what it takes to keep them will give businesses the talent edge over their competition. Explore what the candidates are looking for with SEEK Laws of Attraction.

0 Comments
  • Australia
  • Data Visualisation
  • Interactive Microsite
  • Laws of Attraction
  • SEEK
0 Like!
Share
Datalabs

Data Visualization Training: Workshops & Courses

Shop Online for Data Visualization

  • Image of a man using our Power BI templates to design a report
    Power BI Templates
    Select options
  • Image of our custom Power BI Theme on a computer
    Power BI Theme and Style Guide
    Select options
  • An Introduction to Data Visualization and Storytelling Course
    An Introduction to Data Visualization and Storytelling Course
    Add to cart
  • Photo of a data visualization consultant advising clients and helping solve design issues.
    Data Visualization Consultant
    Buy product
  • Designing Great Dashboards Course
    Designing Great Dashboards Course
    Add to cart

Style Guides for Data?

A photo of our data viz style guide for Microsoft Power BI

Data Visualization & Storytelling Group Workshops

Contact Us

  • This field is for validation purposes and should be left unchanged.

From Our Blog

  • 8 Incredible Examples of Interactive Data Visualization
  • Data Analytics Conferences 2024 & 2025
  • Data Visualization & Design Conferences 2024 & 2025
  • Case-study: Intranet Dashboard Design for Nestlé
  • Dashboard Tips: 3 Alternatives To Using A Data Table
  • Data Visualization Training
  • Brand Guidelines for Data
  • Online Courses & Products
© 2024 Data Arts Pty Ltd
logo