


Datalabs Agency provide a variety of data visualisation training workshops. This is recommended as a perfect accompaniment to your style guide as you’ll learn best practice design through personalised theory and guided exercises. We run a large variety of workshops tailored to specific industries and software. Talk to us about how you can package the workshop up with your style guide.
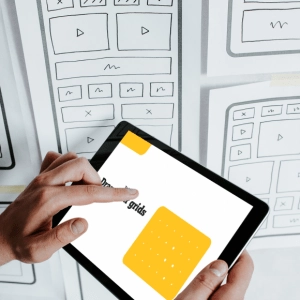
Infographic Report Style Guides
A style guide is an essential asset for any business looking to unify and use best practice and on-brand data visualization. This style guide will provide you with all the techniques and instructions required to produce high end report designs.
What’s Included in Your Report Style Guide?
Designing a report
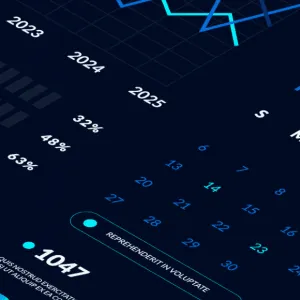
Charts
Templates
Styling
Instructions
Extra
Views on Our Infographic Report Style Guides?
“Everyone is very pleased with the template that was produced by the Datalabs Agency, and I found them very pleasant to work with and open to our ideas. We have now produced a number of final study reports using the templates and they look great.”
Style Guide Feedback
Victorian Institute of Forensic Mental Health
“Thanks for the design overview and the development assets. The style guide is very detailed and informative.”
Style Guide Feedback
Daimler - Mercedes Benz
Pair Your Style Guide with Training!
Get trained to visualize data and tell better stories.
Original price was: £66.00.£34.00Current price is: £34.00.
Get expert advice on data visualization from our agency's Managing Director.
Infographic Report Style Guides from the Datalabs Agency
Standard Class
Business Class
Our Simple Steps for Creating Report Guidelines
Other Offerings That Go Well With an Infographic Report Style Guide
Data Visualization Workshop
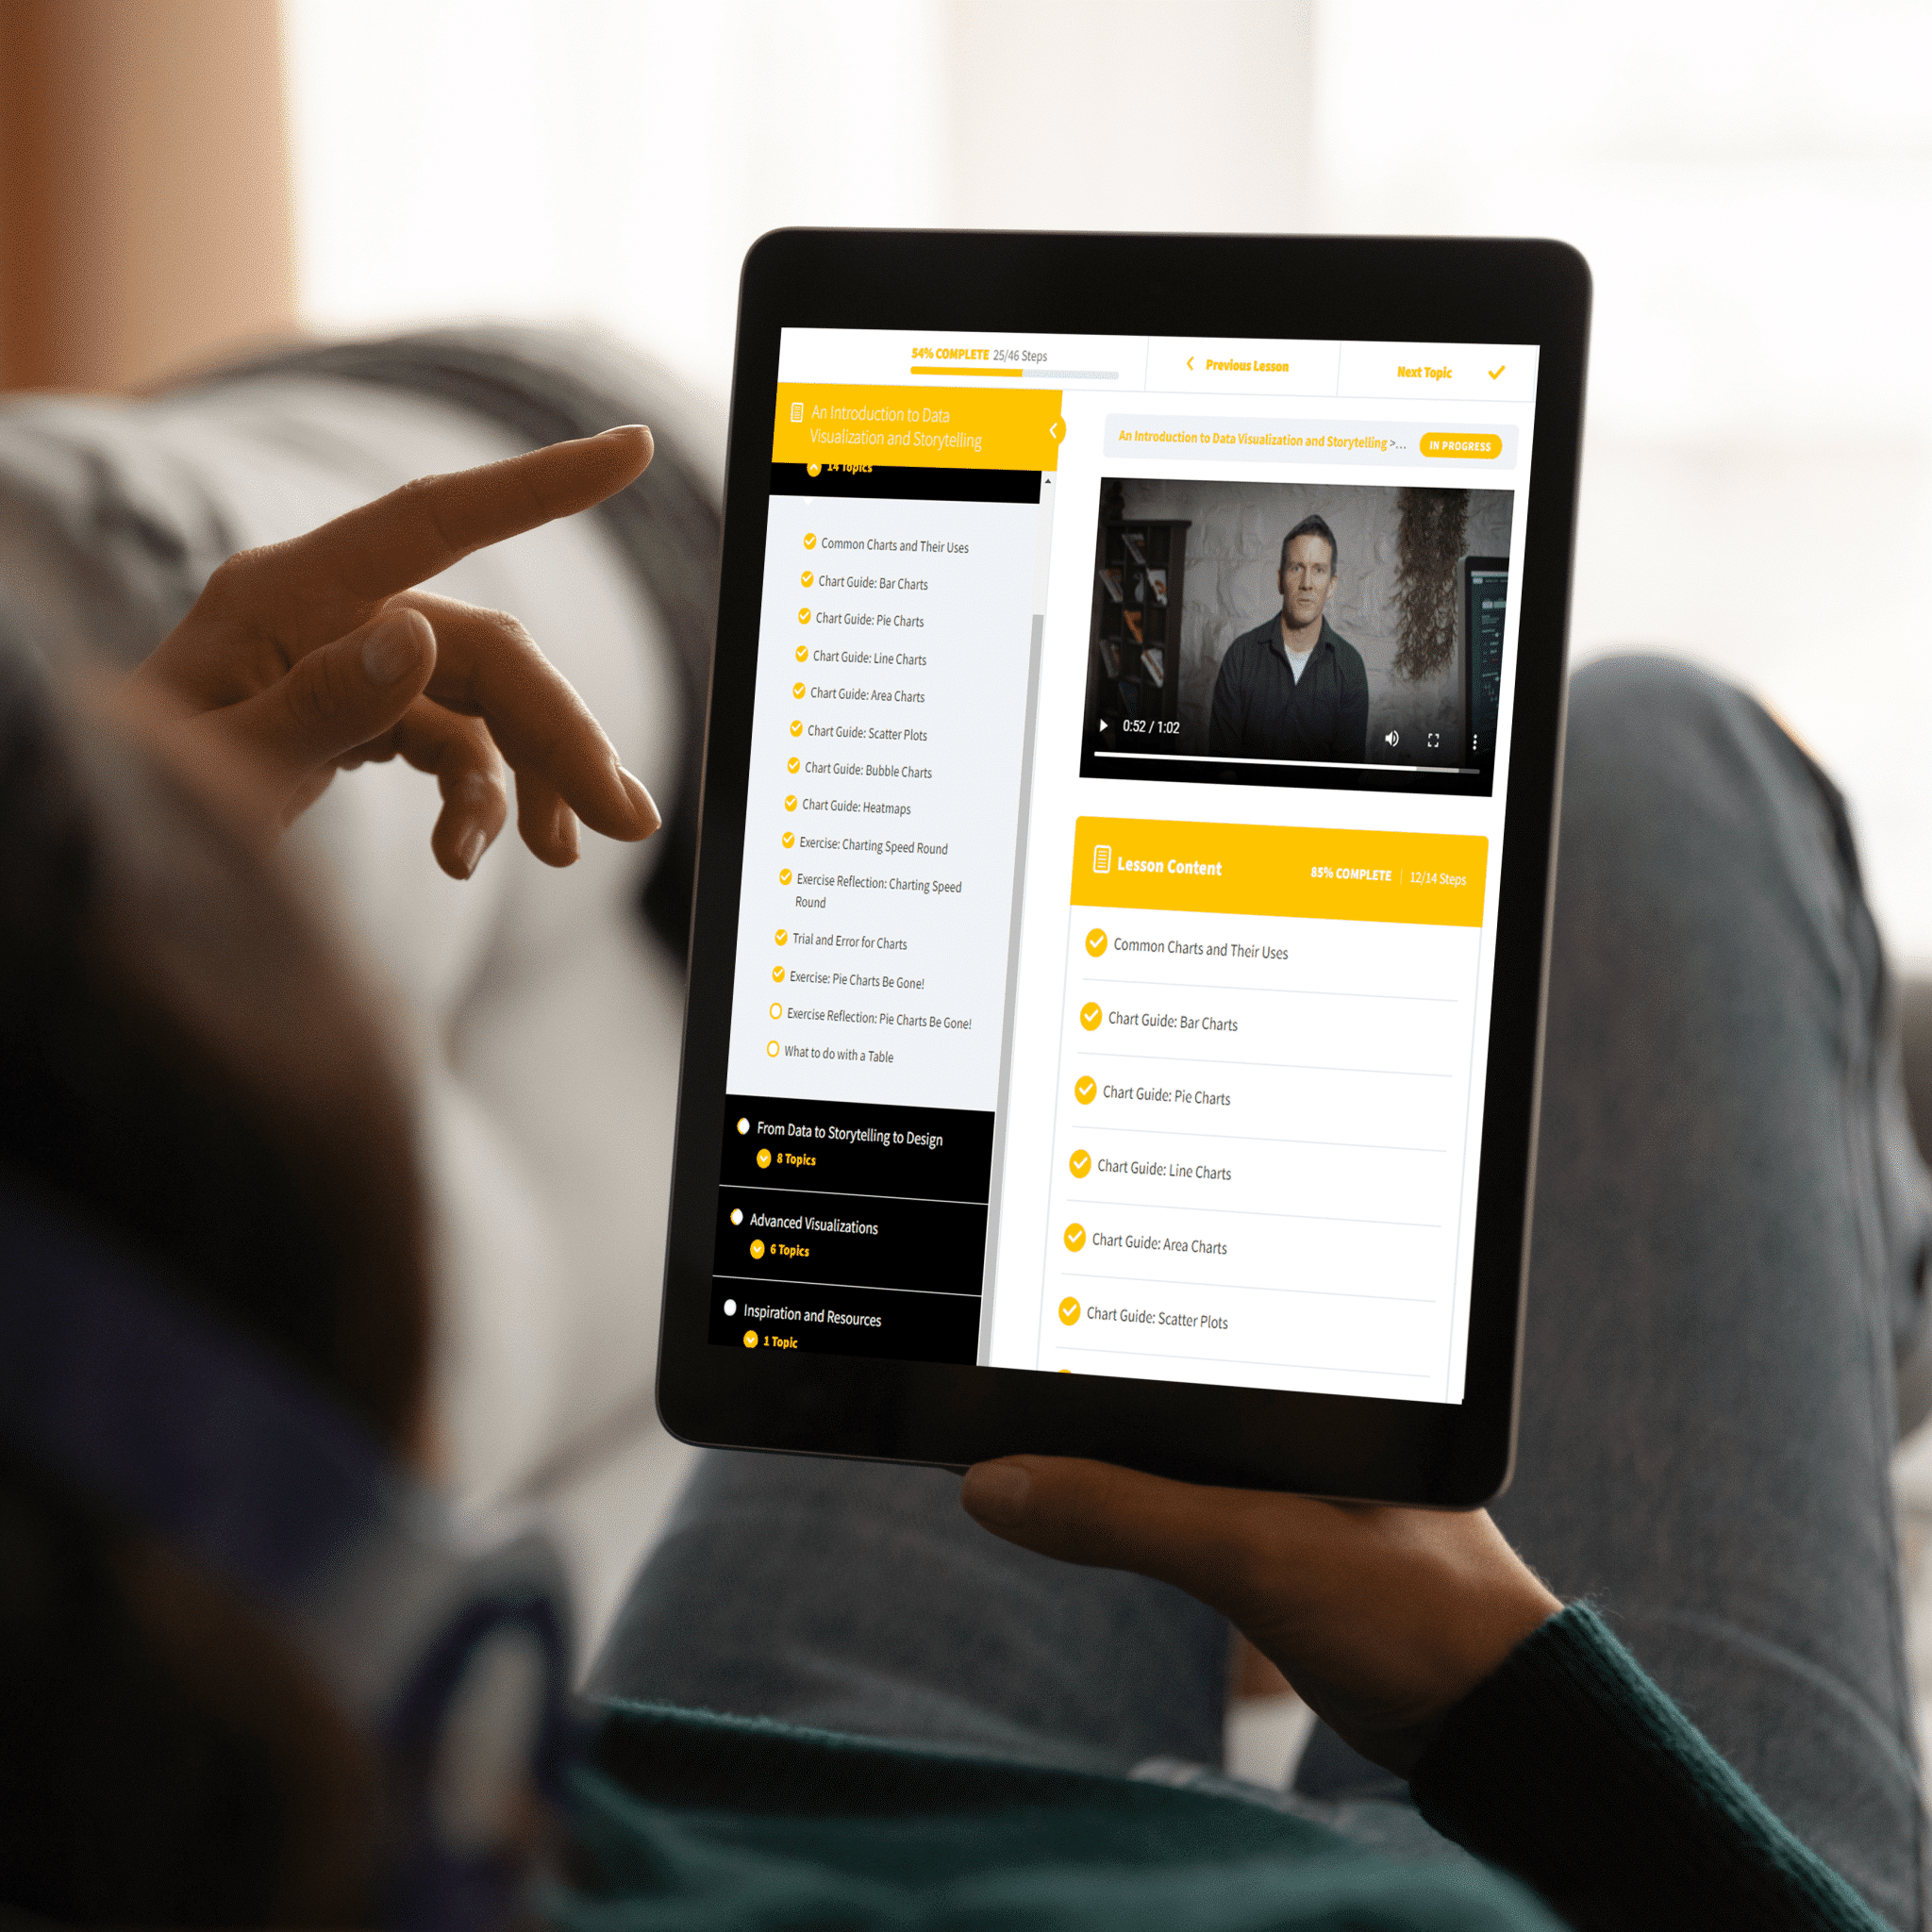
Data Viz Online Learning
Learn the basics in data visualization and storytelling in your own leisure with an online course. This course runs through, step by step, our process which has been tried and tested to produce quality designs which meet your purpose. We recommend taking the eLearning course to warm-up to the theory and practical elements in data viz and then applying it to your work whilst referencing your style guide. The two go hand-in-hand.

Design Services
Let us take the first design using your style guide to show just what your brand is capable of. Maybe you have a challenge that you would like some expert assistance with. By utilising the Datalabs Agency’s experienced team, we’ll take you through our process whilst working through your challenges. This will leave you with a benchmark design to reference and take into future projects with your style guide on hand.