


Our Top 5 Interactive Visualizations
Want to be inspired? Here are the best interactive data visualizations we have ever seen…
Humans are visual creatures. We respond to visual data better than any other type of data, processing visuals over 60,000 times faster than text. With the advancement of technology, there has been a marriage between data visualization, high-aesthetics, and functionality.
Creators of good data visualizations today know how to encapsulate comprehensive data into something that is aesthetically appealing and taking it one step further by adding interactivity. By giving users a chance to click, scroll, and move their cursor along interesting data points — essentially engaging with and being immersed in the data — designers enable users to become participants rather than simply viewers. And what this really means is a more effective data learning process.
In today’s post, we put the spotlight on the best interactive data visualizations we’ve come across and loved, which can serve as inspiration for any data enthusiast.
1. Worldshapin
Truly a unique data representation, Worldshapin lets users compare development factors of different countries in an odd yet interesting way. The data is presented in color-coded shapes, which can be manipulated by dragging the cursor across a timeline, allowing a moving visualization of the changes that happened in different geographic regions over time. It’s easy-to-use, insightful, and presents data in a fresh way. But most of all, it harnesses the power of interactivity to allow the user to choose their own learning experience.
2. The Evolution of Trust
Who doesn’t love a little game? With a knack of making complex topics fun, Nicky Case in The Evolution of Trust delves into the rise of mistrust and suspicion in today’s society through game theory, represented in — you guessed it — a game format. In this 30 minute game (trust us, it’s worth your time), users are able to see how cheaters prosper in the short run but lose in the end. It’s fascinating and entertaining, a deadly combo that makes for amazing data visualization.
3. Selfiecity
Selfies have taken over the world. Selfiecity is a project that studies the way people take self-portraits in various parts of the world. Do women take more selfies than men? What’s the proportion? Which city smiles the most? Analyzing over 120,000 selfies of people from Berlin, New York, Bangkok, Sao Paolo, and Moscow, these questions have been answered. The complexity of the study might make it a challenge to expose the results and insights found, but the designers pulled through, creating one of the best data visualizations we’ve seen in the past years.
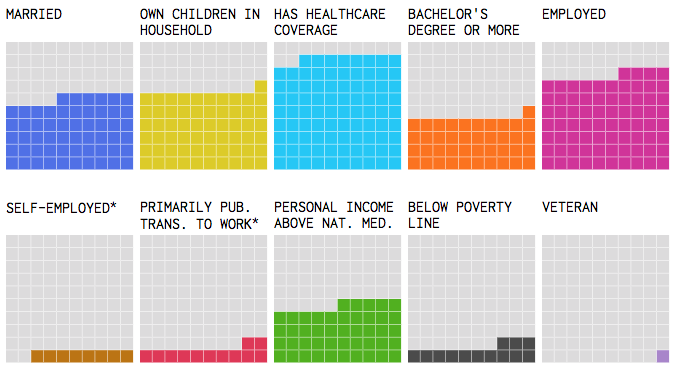
4. The Demographics of Others
Nathan Yau’s The Demographics of Others explores geographical data of various demographics in the USA, based on the 2016 American Community Survey. Nathan explains, “I think we can all benefit from knowing a little more about others who aren’t like us (or who are), no matter how small the tidbits.” In the graphic, users can select various sex, age, and race group, and see how the demographic information differs when different factors are changed. The simplicity is beautiful, but what we love most is the extra touch of animation when toggling between the filters. It really highlights the differences in data, making for an intuitive analysis.
5. How Music Taste Evolved
It is truly difficult to round this list off. Instead of picking the most useful, we picked the most interesting for number five — so lucky last on our list is How Music Taste Evolved. Requiring headphones, users are able to explore and listen to the different tunes that have reached #1 on the Billboard Top 100, from the year 1958 to 2015. As users click through different years, the line graph moves by itself, showing a living, breathing data visualization of the changes in popular music. It’s a reminder that good data visualization does more than simply present information — it tells a story.