


Updated October 2026
A guide for analytics teams…
Data Storytelling
Data storytelling is building an analysis around one message, so the people reading it know what to do next. The data supports a recommendation. It is never the whole presentation.
A story in seven steps…
Choose a plot
An illustration of the Datalabs information and story design process. The dots and numbers are not real data.
The short answer…
What is data storytelling?
Data storytelling means organizing an analysis around one message so your audience knows what to do next. The data supports a recommendation; it is never the whole presentation. The Datalabs Agency teaches the method to analyst teams in workshops, from finding the story in a dataset to designing the visuals that carry it.
The Datalabs Agency is a Melbourne-based data visualization consultancy founded in 2012 that delivers corporate training workshops (Power BI, Tableau, data storytelling), dashboard design, and BI style guides for clients including Mercedes-Benz, Adidas, and UPS.
The problem behind the brief…
Why do analytics teams need it?
Most analytics teams have plenty of analysis and too little message. The usual result is a data-dump presentation that buries the point, when leaders want the number that matters first. Data storytelling moves an analyst from reporting the data to advising on what to do about it.
That was the brief behind seven workshops for Adidas Global Procurement and a lecture-and-workshop program for ZIM’s analysts. Public sector teams face the same problem with dense reports, which is why the Visual Storytelling for Government workshop exists.
STORY FIRST.
CHARTS SECOND.
Plan it on paper…
Find the message before you open the software
Plenty of analysis, no message: that is the usual problem. Decide the one message first, then build every chart around it.
- Define your audienceWho reads it, and what do they need to decide?
- Decide one objective“I want my audience to…” Pick one.
- Answer six questionsScope, context, insight, order, motivation and call to action.
One program, in numbers…
Adidas Global Procurement
In late 2022 the Datalabs Agency ran a custom data storytelling program, delivered live from Melbourne.
7
workshops
150
people, about
4
continents
3
weeks

Click a logo to read the case study…
Clients with a visual case study







Learn it with your team…
Practise on your own numbers
In the workshops, teams hunt for micro-stories in their own data, rank them, then choose the order to tell them in. Adidas Global Procurement ran seven workshops. ZIM’s analysts took a lecture-and-workshop program.
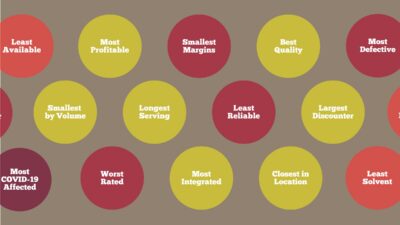
- The superlatives exerciseFind the most, least, best and worst in a table.
- Rank the micro-storiesPut the stories in order before drawing a chart.
- Choose a plotLinear, reverse-engineered or 360-degree.
Seven steps, audience first
From audience to insight
The information and story design process taught in the Datalabs workshops. Start with the person who will read it and finish with the insight highlighted.
Context, insight, call to action
The three-act structure
Every business story follows the same three acts.
| Act | What it covers |
|---|---|
| 1. Context | The situation: what the audience needs to know first. |
| 2. Insight | The “so what?”: the finding that matters. |
| 3. Call to action | What to do next. |
A report built on three acts ends with a recommendation, never a shrug.
Click the markers
Read a story-ready dashboard
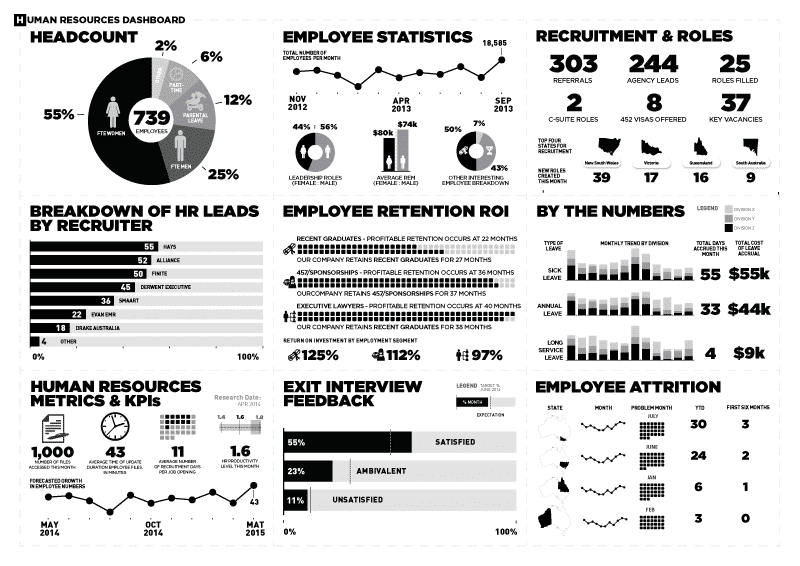
The Datalabs HR dashboard, designed by Otto Ottinger: twelve panels, one page, one story. Click the markers to see how it reads.
Hunting for the story…
How do you find the story in a dataset?
Look for micro-stories: segments and cohorts, outliers and superlatives, and overlaps and gaps. Each is a small, sharp narrative hiding inside a big dataset, and the strongest usually sit at the edges: the most profitable, the least reliable, the thing that does not fit.
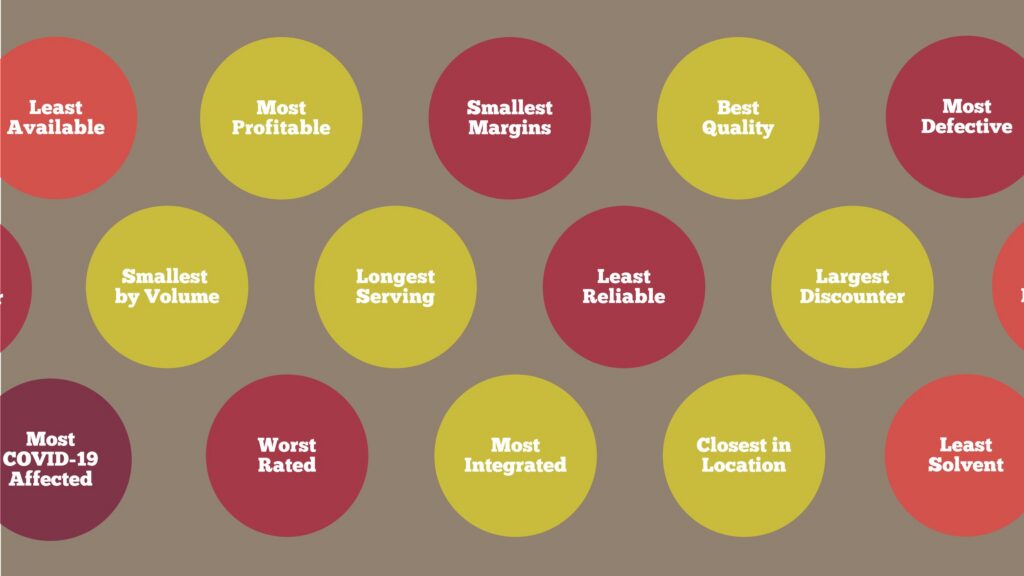
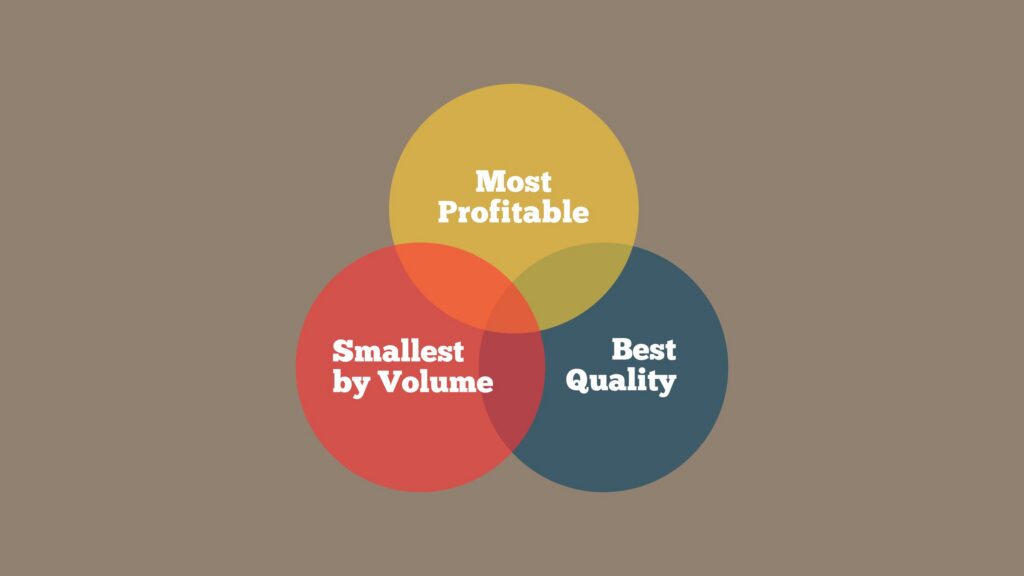
In the Adidas workshops, teams awarded superlatives before drawing a single chart: which supplier is most profitable, least reliable, the largest discounter, the closest, the worst rated. A Venn version then asks which supplier is most profitable, smallest by volume and best quality at once. That intersection stops being a data point and becomes an argument about where the next contract should go.
The teaching assets, full size
Inside the workshop materials
Click any asset to view it full-screen. These are slides and exercises from the Adidas and ZIM programs.
Finding the small stories in big data
Micro-Stories
Zooming back out to the big picture
Macro-Stories
Suppliers become characters
The Superlatives Exercise
One supplier, three stories
The Superlative Venn
Carrying the message
Five pillars and one rule
Five tools for carrying a message, plus one rule: cut what does not help. Thinking in arrays comes first: sketch several visual options on paper before you commit to a default chart.
Match the sequence to the audience
Three ways to plot a story
The order of your information should match your audience and the time they have.
| Plot | What it does |
|---|---|
| Linear | A straightforward, step-by-step sequence of insights. |
| Reverse-engineered | Front-loads the main insight, then adds the supporting context. Ideal for time-constrained executives. |
| 360-degree | Looks at the data from several perspectives, such as division, product or time, to uncover hidden stories. Suits dashboards. |
Tailor the level of detail to how the story is used: presented live, or sent as a document.
Before any software opens…
The six-question filter
Clarify six things first. Teams that skip this step design charts for a message nobody has chosen.
Answer these in order, on paper.
1
Data scope
What data belongs in this story?
2
Context
What does the audience need to know first?
3
Main insight
What is the one finding that matters?
4
Plot sequence
In what order will the audience meet it?
5
Motivation
Why should this audience care?
6
Call to action
What should they do next?
AI in the process…
Where does AI help?
AI helps most with summarizing. It can pull the main points out of a complex dataset quickly. The analyst still decides which insight matters and designs the final visuals.
Who does what…
Three jobs
- SummarizeUse AI tools to extract insights and summarize complex data.
- JudgeApply your own judgment to the final design and interactivity.
- Choose the formatPowerPoint suits narrative decks. Tableau and Power BI suit interactive, multi-perspective visuals.
Don’t just show the data — show what it means. A great analyst provides the route and the destination, never just the map.

Otto Ottinger
The principle behind the method
Questions & Answers
Data storytelling
More on the topic…
Related reading
Two older posts go deeper on how data storytelling meets dashboards and design: Data Storytelling: The Key to Creating Captivating Dashboards & Infographics and Applying Design Thinking to Data Science.
Hiring a trainer? Read Data Storytelling Workshop Providers: What to Look For When Hiring. To see the method in a real program, read the Adidas and ZIM case studies.


The Data Design Firm for AI & Visualization
The Datalabs Agency
Templates, guides, grids, icons…
Creative Design Assets »
Learn visualization and storytelling skills…
« Beautiful Courses in Data Design
Some of the notable brands Otto has worked with…
Otto Ottinger’s Clients of Note








Professional & Thought-provoking
Looking for a speaker for your event?
"*" indicates required fields